
Figure 2. Measuring the impact of DUB CRISPR-Cas9 knockout on cell phenotypes.
(A) 81 DUBs covering the majority of the DUB phylogenetic tree were targeted in MDAMB231 cells using an arrayed CRISPR-Cas9 library (black circles (Figure 2 cont.) designate knockouts included in screen). (B) The impact of DUB loss on the transcriptome was profiled using high-throughput 3’ DGE RNA-seq 96 hr after transfection with CRISPR-Cas9. (C) The impact of individual DUB knockouts on the transcriptome of MDAMB231 cells, 4 days post CRISPR-Cas9 guide transfection as quantified by the number of differentially expressed genes (adjusted p-value <0.05). Guide RNA transfections were performed in triplicate and transcriptional responses then averaged. Knockouts that resulted in more than 20 differentially expressed (DE) genes are colored red. (D) Hierarchical clustering of log2FC values for significantly differentially expressed (DE) genes (adjusted p-value <0.05) for the knockouts colored red in (C). (E) Gene set enrichment analysis results for DUB knockouts that resulted in at least 20 DE genes. Gene sets that were significantly enriched (FDR <0.05) and in the top five up- or down-regulated gene sets in at least one condition are shown. PRPF8 knockout did not result in any significantly enriched pathways so it is not displayed.

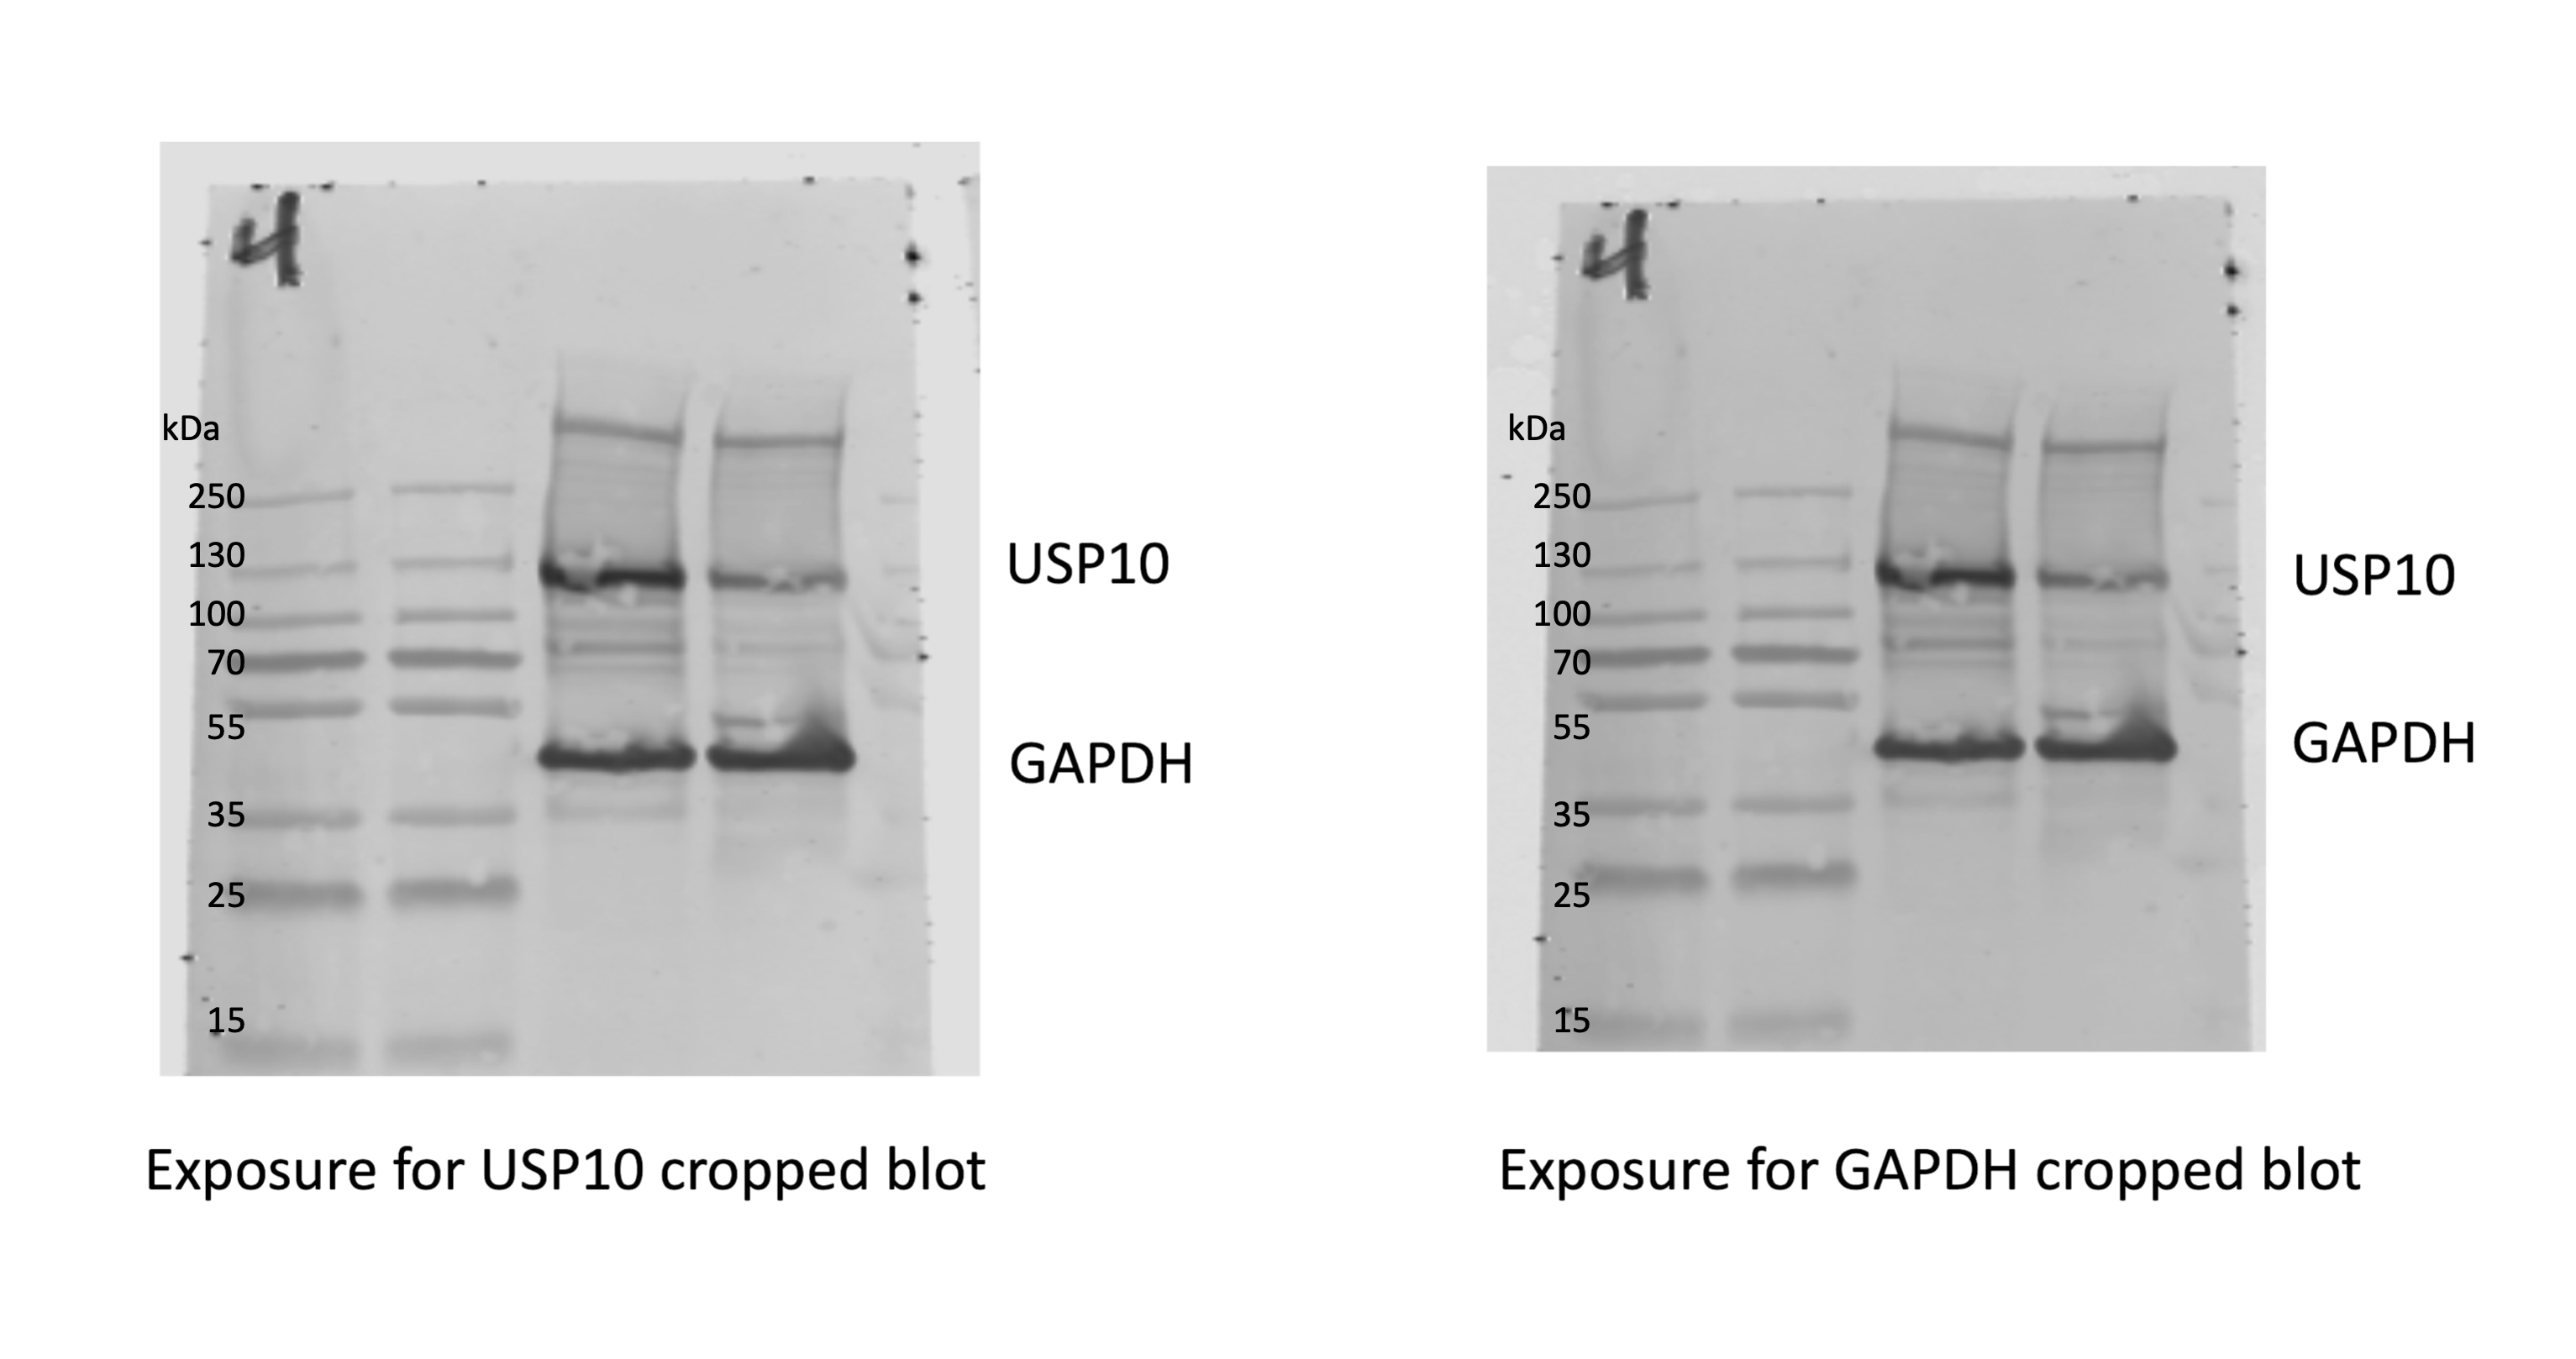
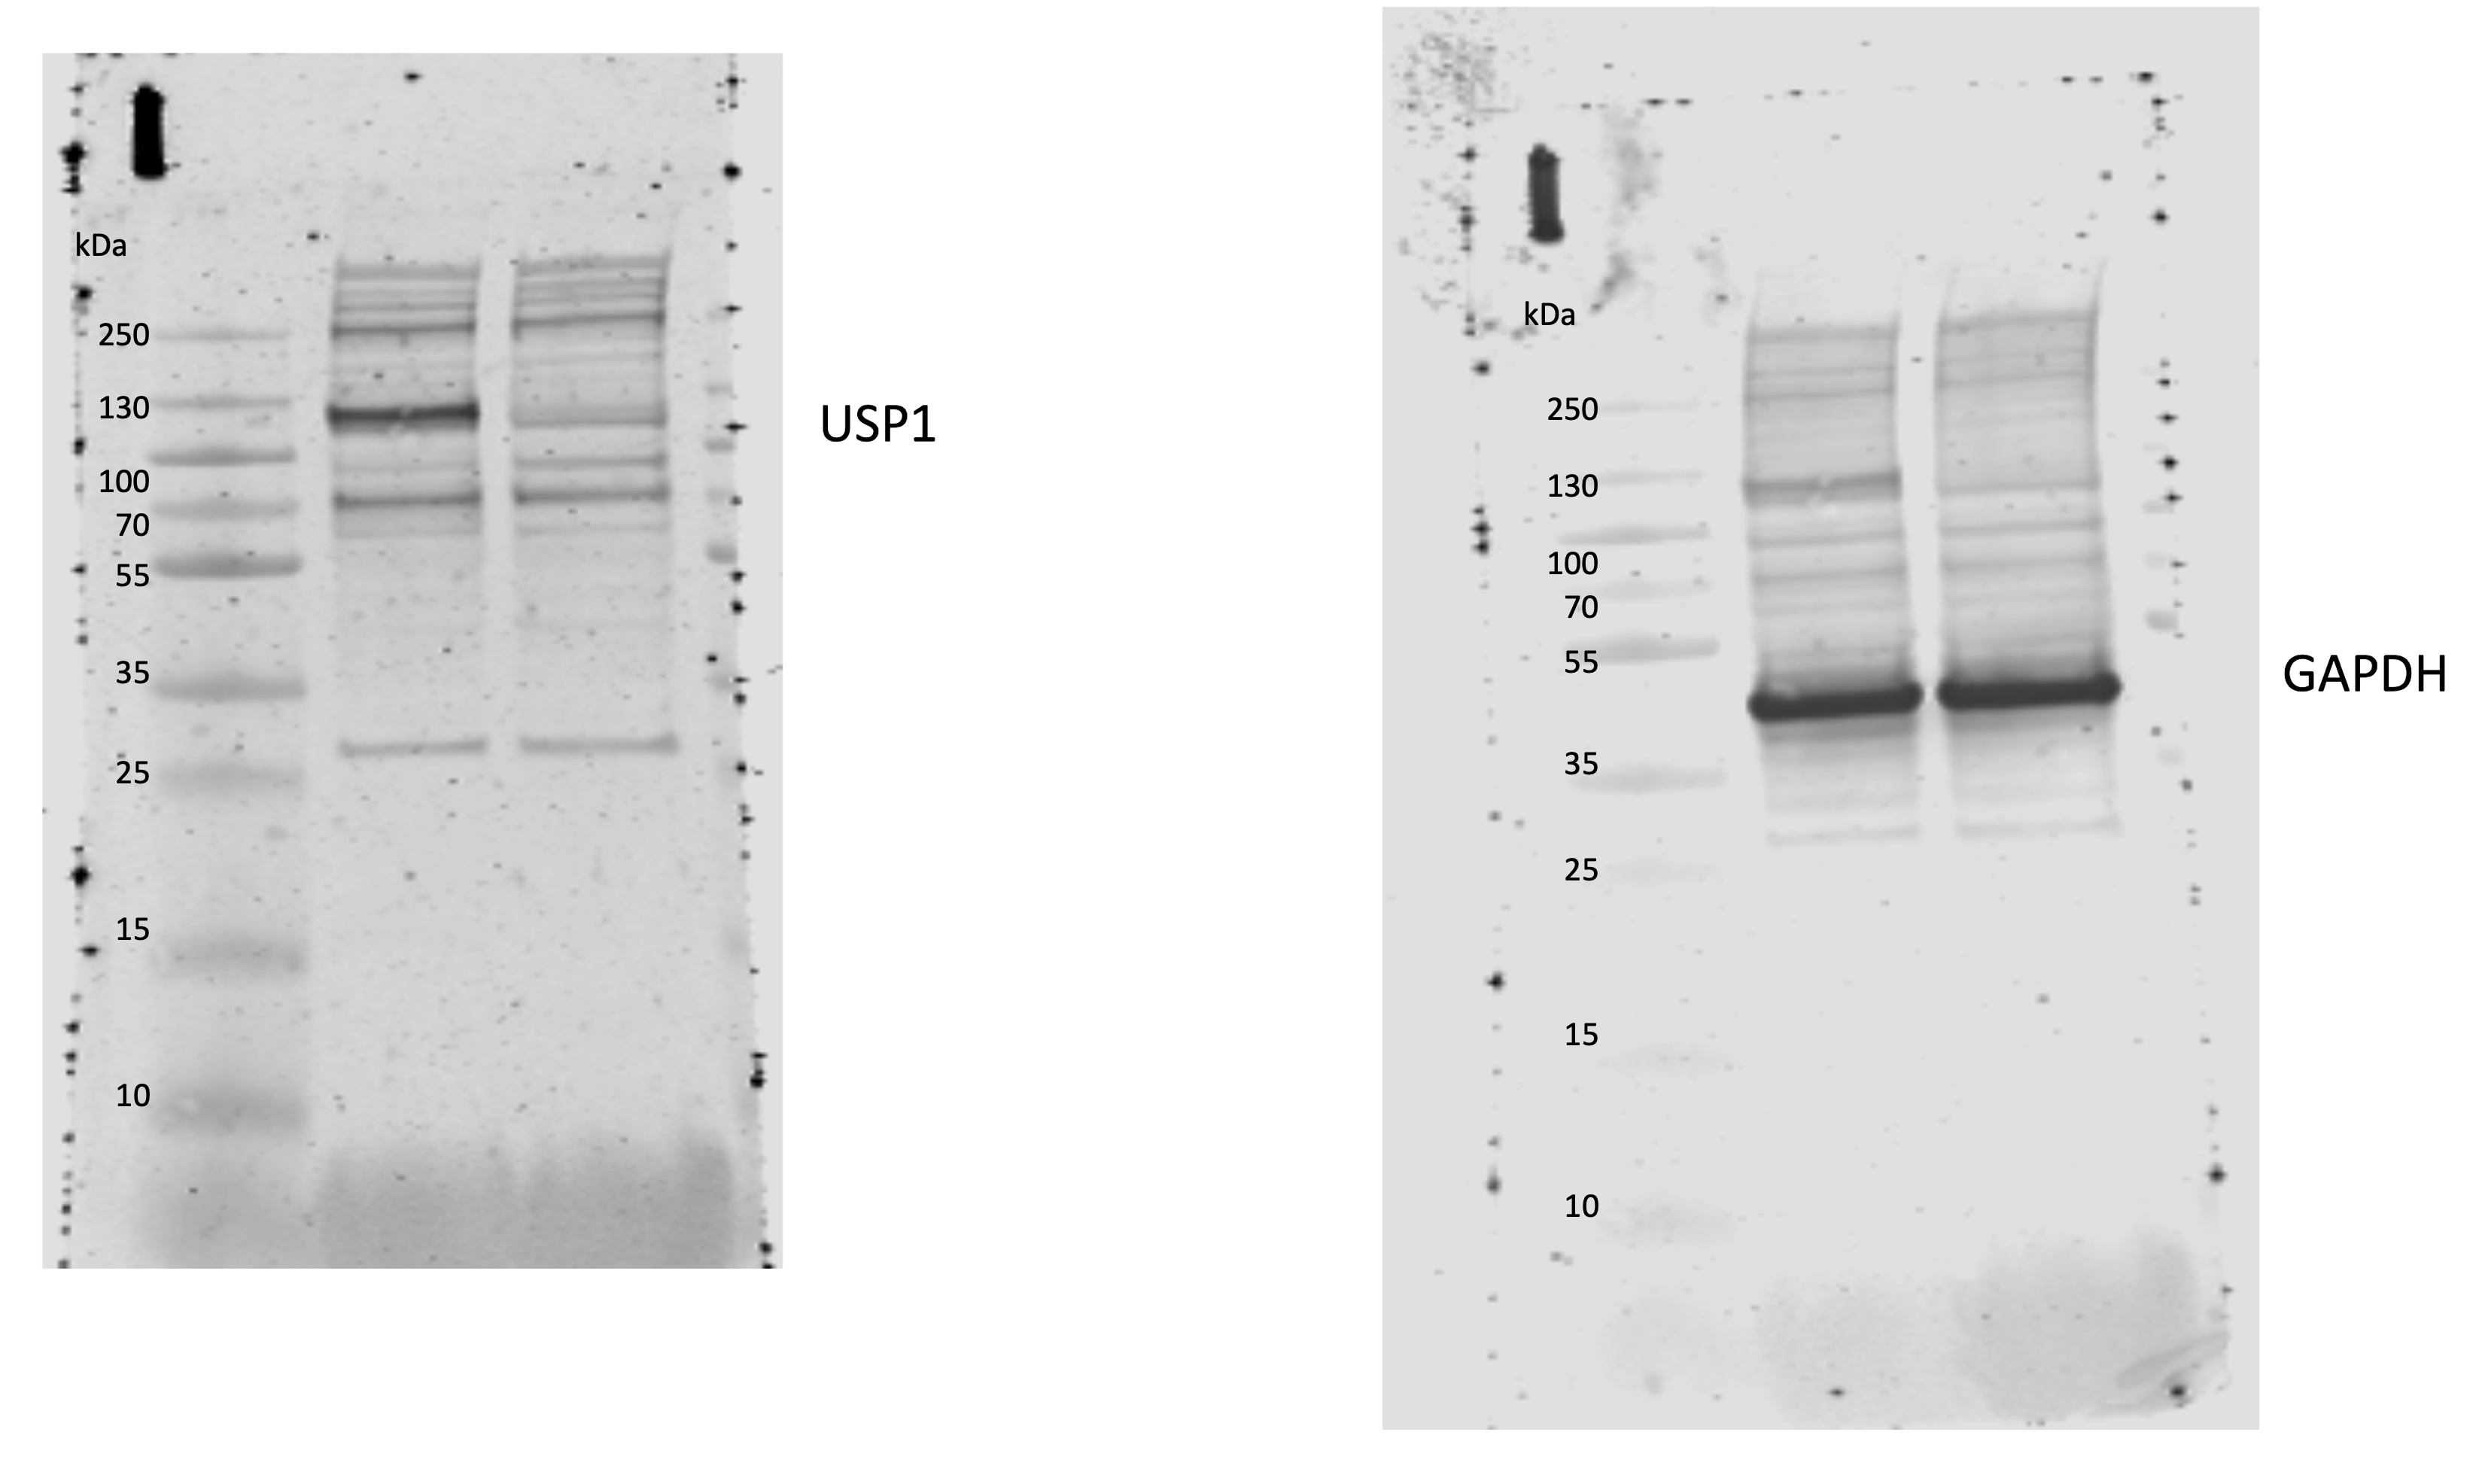
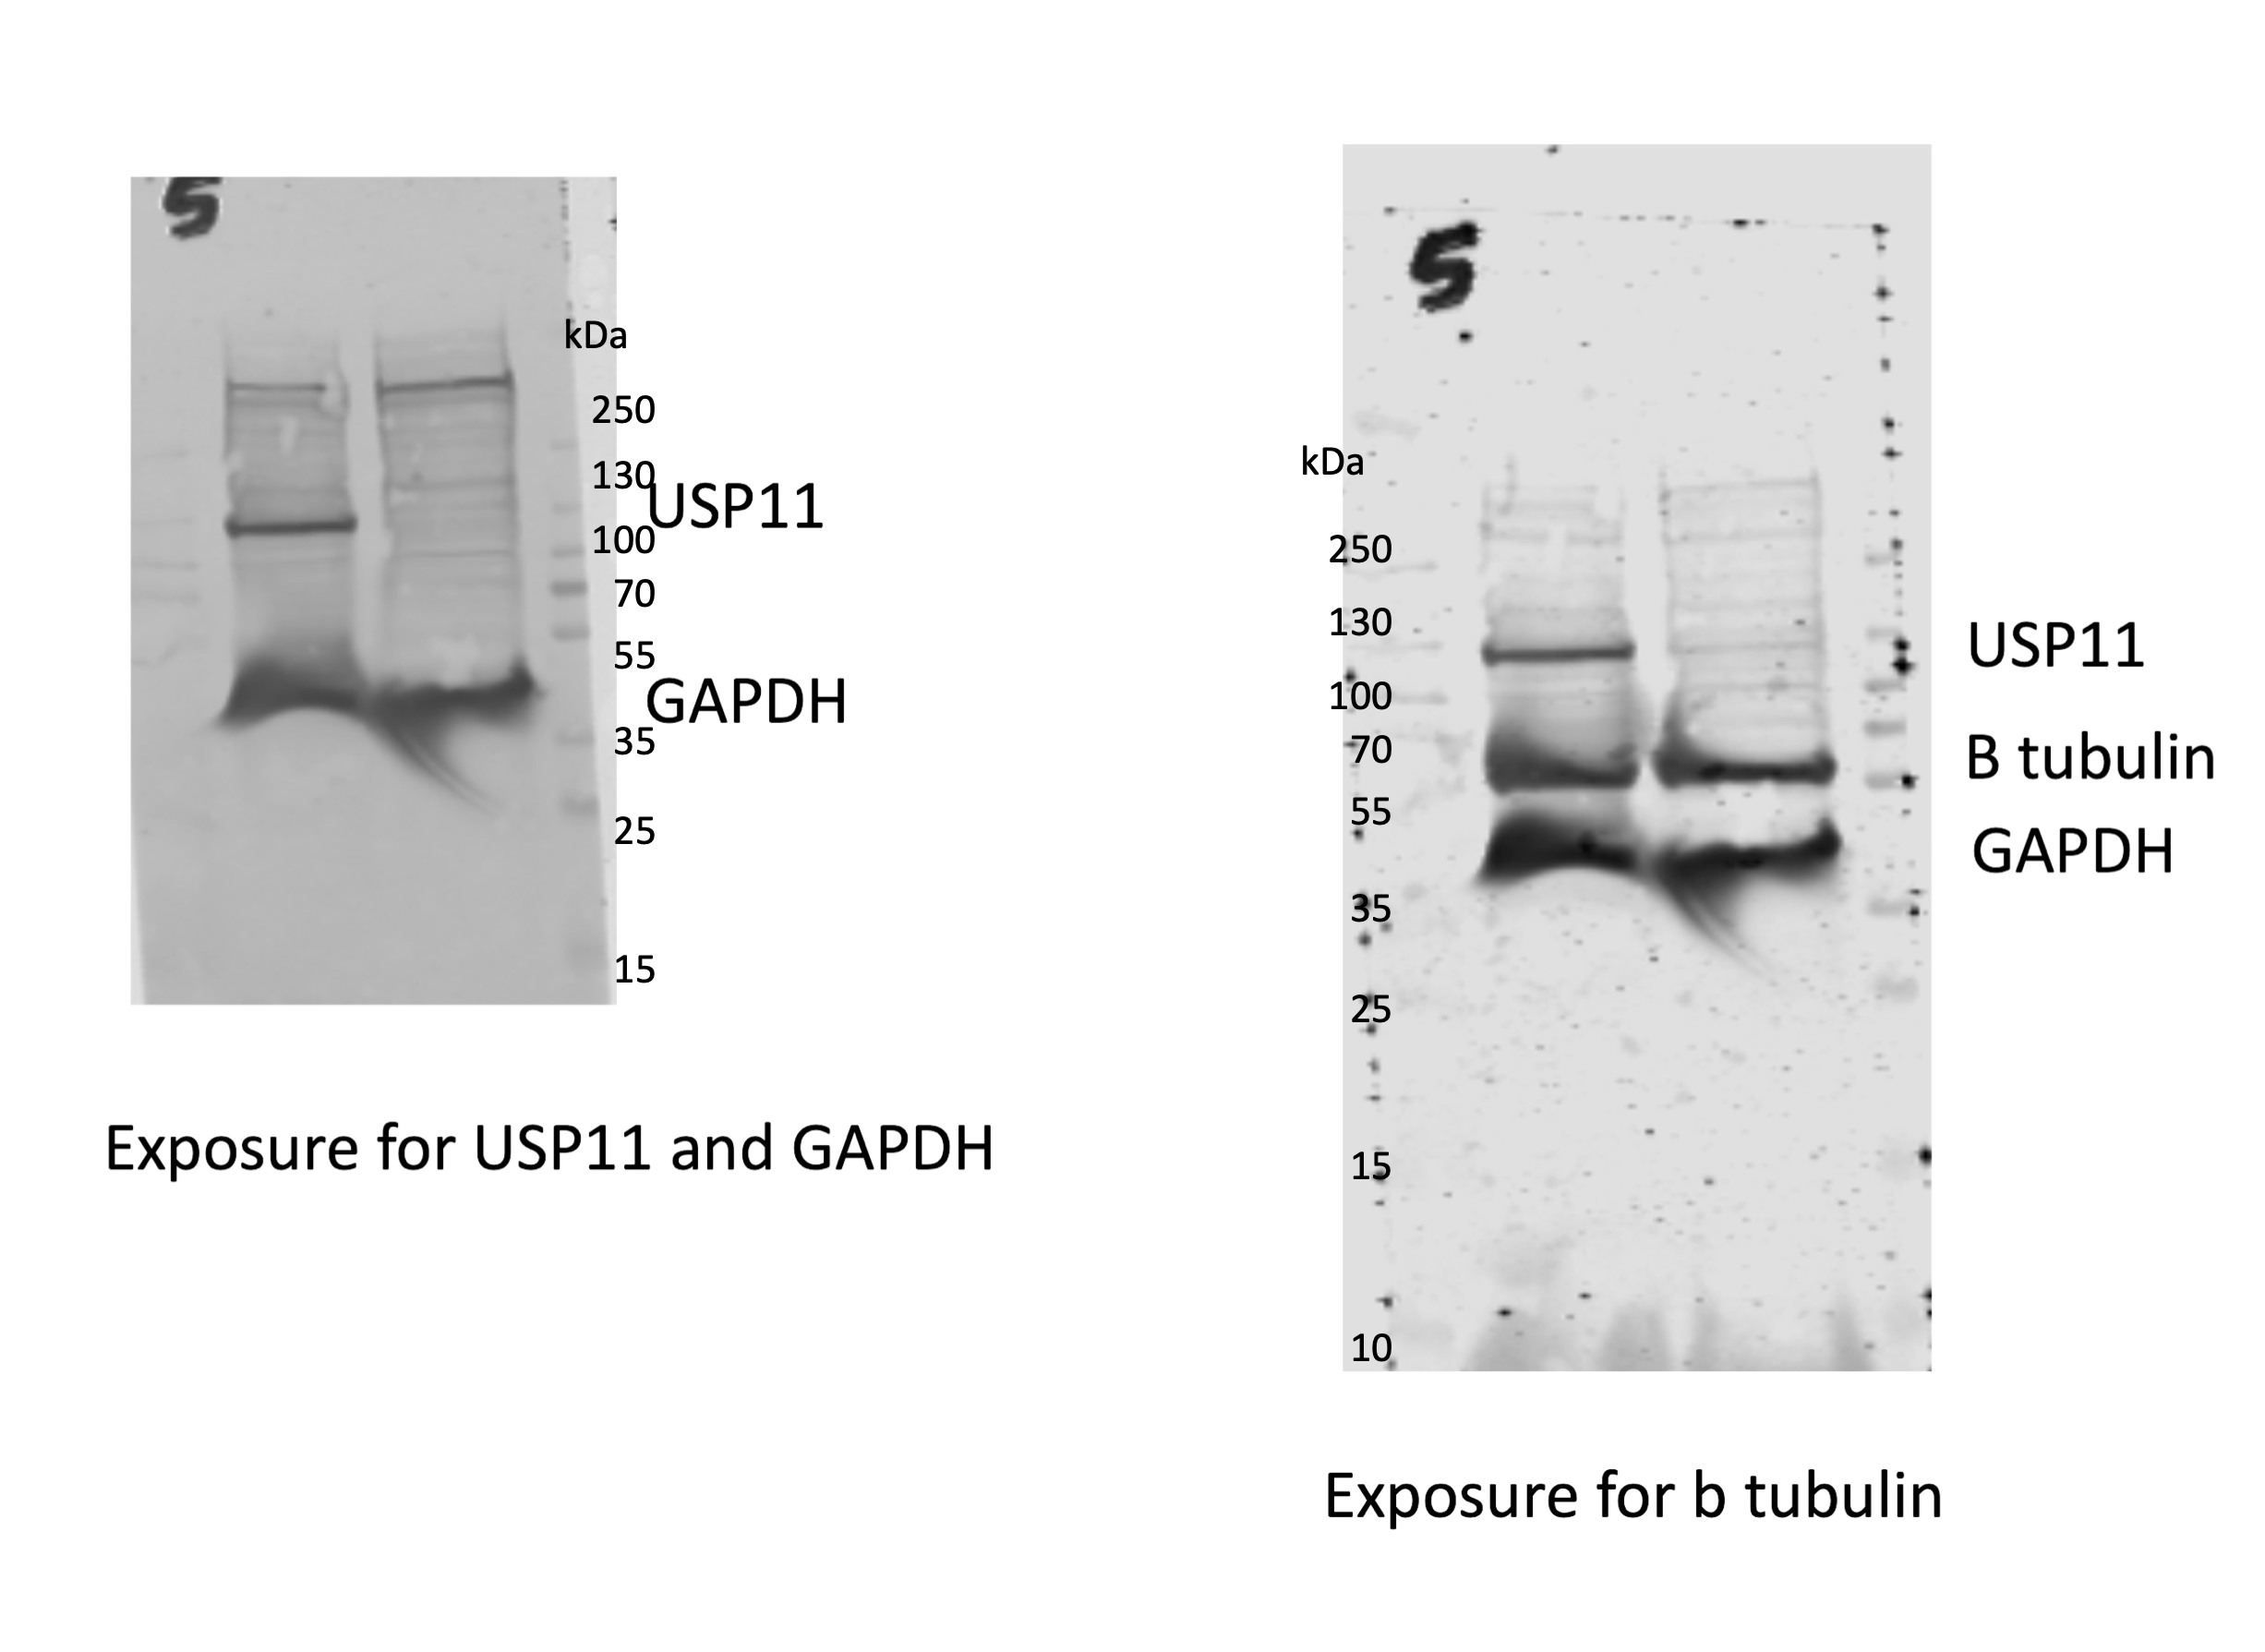
Figure 2—figure supplement 1. Assessment of CRISPR-Cas9 guide target downregulation.
