
Figure 3. DUB essentiality and codependency relationships in DepMap.
(A) The fraction of cancer cell lines present in the DepMap that are strongly dependent on each DUB (using recommended threshold CERES <–0.5). Bars are colored coded based on knockout mouse phenotype data from the IMPC and MGI datasets. (B) The strongest co-dependent genes for each DUB (n=7 but similar results were obtained for n=5–10). For visualization purposes, only DUBs that either had a significantly enriched GO term, a co-dependent gene supported by PPID or CCLE proteomics co-expression, or scored as essential in at least 20% of DepMap cell lines are displayed (see Supplementary files 6 and 7 for complete codependency results). The inner ring (ring 1) contains the top GO term for the co-dependent genes for each DUB (highly similar GO terms are grouped to aid in viewing the data, see Supplementary file 5 for all GO results). The second ring contains the DUB gene name. The third ring contains the fraction of cell lines strongly dependent on the DUB. The fourth ring contains the co-dependent gene name (green if DUB – co-dependent gene pair exists in a protein-protein interaction database). The fifth ring contains the Pearson correlation value for the DUB-co-dependent gene pair (red represents a positive correlation and blue represents a negative correlation). The sixth ring designates which co-dependent genes had similar transcriptomic profiles in CMap or were co-expressed in baseline proteomics with the respective DUB.

Figure 3—figure supplement 1. Differential DUB dependency by cancer type.
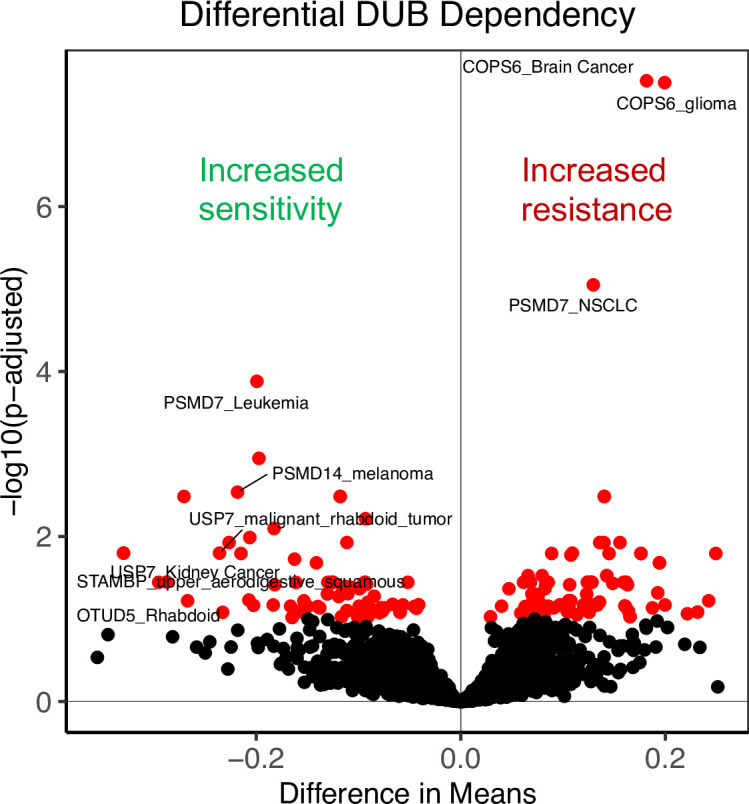
Figure 3—figure supplement 2. Assessing the association between DUB abundance and dependency.

Figure 3—figure supplement 3. Copy number loss of individual DUBs in various tumor types.

Figure 3—figure supplement 4. Enrichment of interactors and co-expressed genes in co-dependent genes.

Figure 3—figure supplement 5. Enriched GO terms that are common across analyses.
