. 2022 Jun 23;11:e72879. doi: 10.7554/eLife.72879

Figure 4. Discriminating the functions of well-studied DUBs.

(A) Changes in gene expression (log2 fold change vs. log 10 adjusted p-value, adjusted p-value <0.05 colored red) in MDAMB231 cells 96 hr following USP14 knockout by CRISPR-Cas9 (left) or 24 hr after treatment with the USP14 inhibitor I-335 at 20 µM (right). (B) Hierarchical clustering of significantly differentially expressed genes (adjusted p-value <0.05) 96 hr following knockout of USP8 or UBAP1 in MDAMB231 cells. (C) Gene sets significantly (FDR <0.05) enriched in MDAMB231 cells 96 hr after knockout of USP8 or UBAP1. The top five upregulated and top five downregulated gene sets for each condition are shown. (D) Hierarchical clustering of significantly differentially expressed genes (adjusted p-value <0.05) 96 hr after knockout of USP7 or C16orf72 in wild-type MCF7 cells or following a 24 hr treatment with 5 µM nutlin3a or 1 µM XL-177A in wildtype or p53 knockdown MCF7 cells. (E) Gene sets significantly enriched (FDR <0.05) for the conditions shown in (D). The top five up- and down-regulated gene sets for each condition are shown.

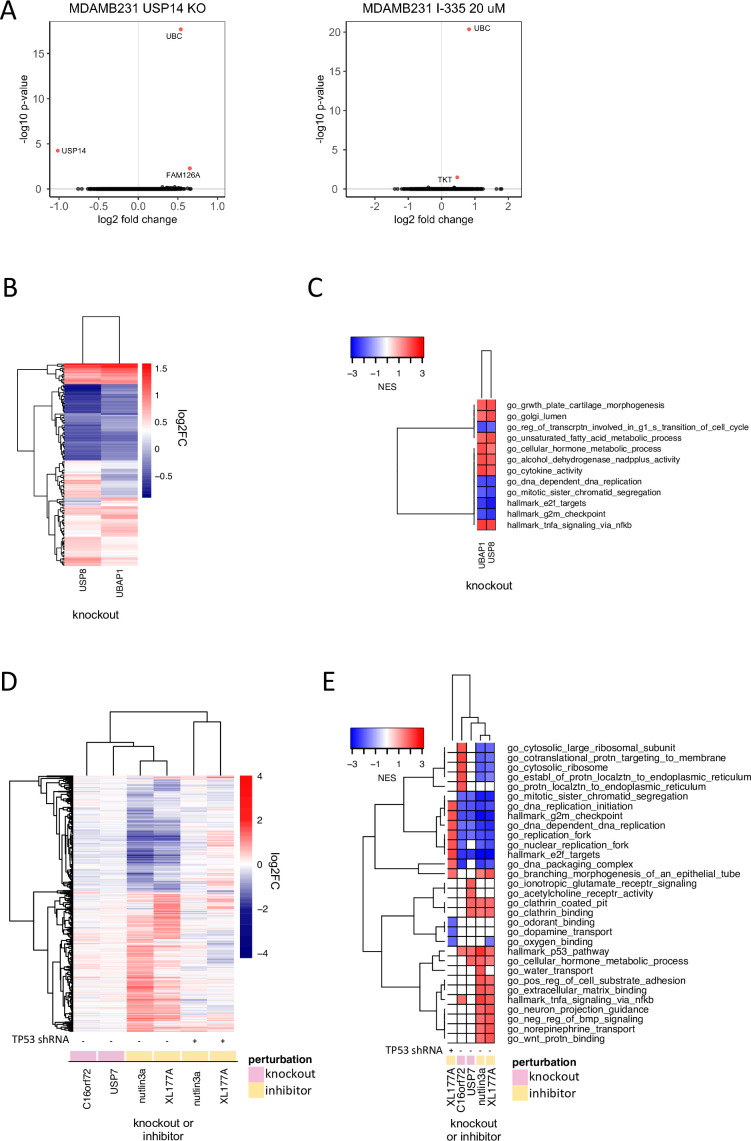
Figure 4.

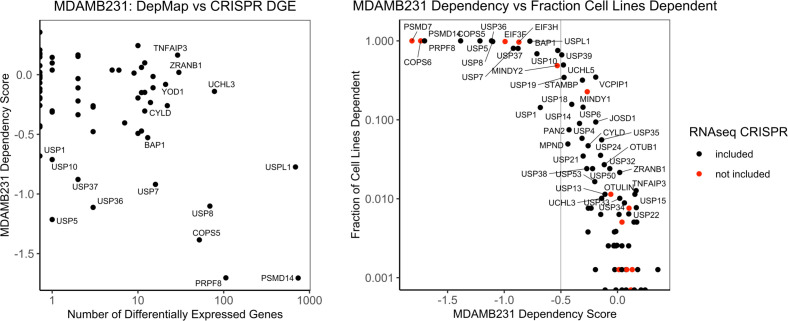
Figure 4—figure supplement 1. Comparison of transcriptional phenotypes and dependency in DepMap.

Figure 4—figure supplement 1.

(A) The number of differentially expressed genes in the MDAMB231 RNAseq screen for each DUB vs the impact of each DUB knock on the proliferation of MDAMB231 cells in the DepMap (CERES dependency score). (B) The impact of DUB knock on the proliferation of MDAMB231 in the DepMap (CERES dependency score) vs the fraction of cell lines dependent on each DUB (CERES dependency score <–0.5).
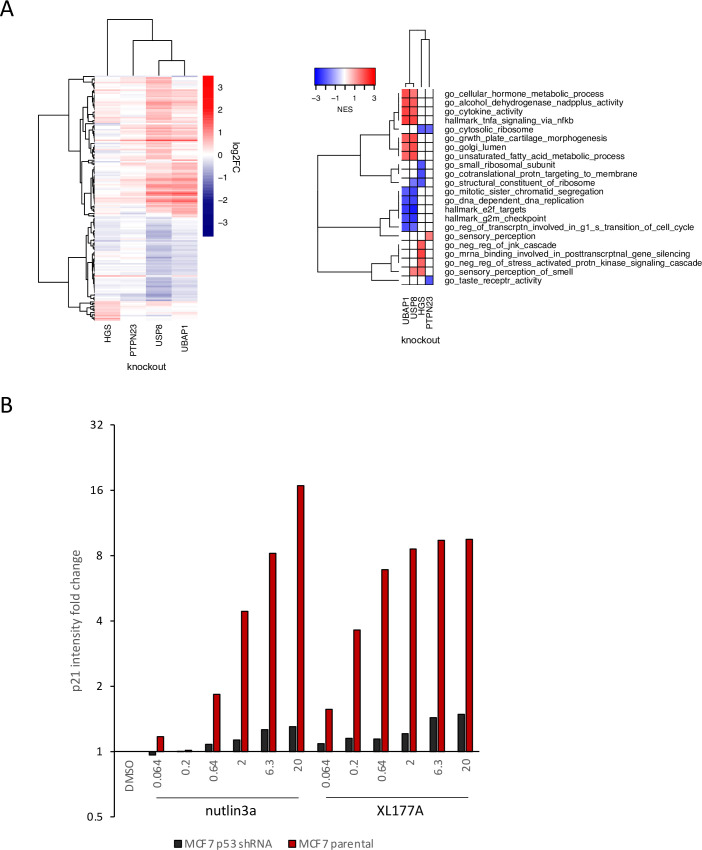
Figure 4—figure supplement 2. Additional analysis of knockouts of endosomal sorting proteins as well as characterization of small molecules targeting MDM2 and USP7.

Figure 4—figure supplement 2.

(A) Hierarchical clustering of significantly differentially expressed genes (adjusted p-value <0.05) 96 hr following knockout of USP8, UBAP1, HGS, and PTPN23 in MDAMB231 cells. (B) Gene sets significantly enriched (FDR <0.05) in MDAMB231 cells 96 hr after knockout of USP8, UBAP1, HGS, (cont.) and PTPN23. The top five upregulated and top five downregulated gene sets for each condition are shown. (C) Quantification of immunofluorescence measuring p21 levels following 24 hr treatments with XL177A or nutlin3a at the concentrations indicated in MCF7 wt and p53 knock down cells.