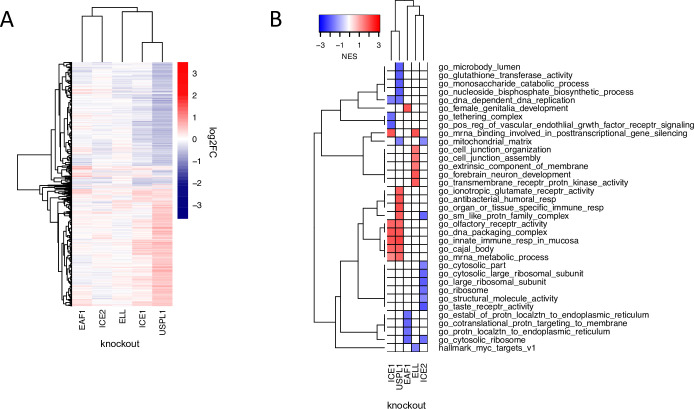
Figure 5. The role of USPL1 role in the Little Elongation Complex.
(A) Hierarchical clustering of log2FC values of differentially expressed genes (adjusted p-value <0.05) 96 h following knockout of USPL1, ICE1, ELL, ICE2, and EAF1 in MDAMB231. (B) Gene sets significantly enriched (FDR <0.05) for the conditions shown in (A). The top five up- and down-regulated gene sets for each condition are shown.

