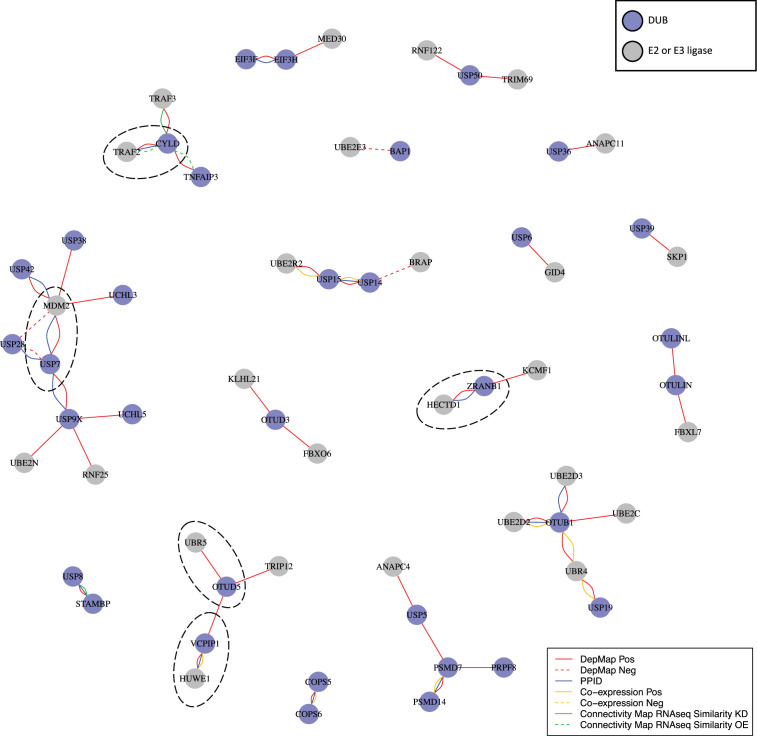
Figure 6. DUB E3 ligase network.
: Ubiquitin or ubiquitin-like transferases whose co-dependency relationships correlated with DUBs in the DepMap. DUBs are colored blue and ubiquitin transferases are colored grey. Red lines represent correlations in the top seven co-dependent genes. Green lines represent similarity by CMap (tau similarity score >90). Yellow lines represent co-expression in proteomics (FDR <0.01 and |z-score|>2). Blue lines represent interaction in protein-protein interaction databases.

