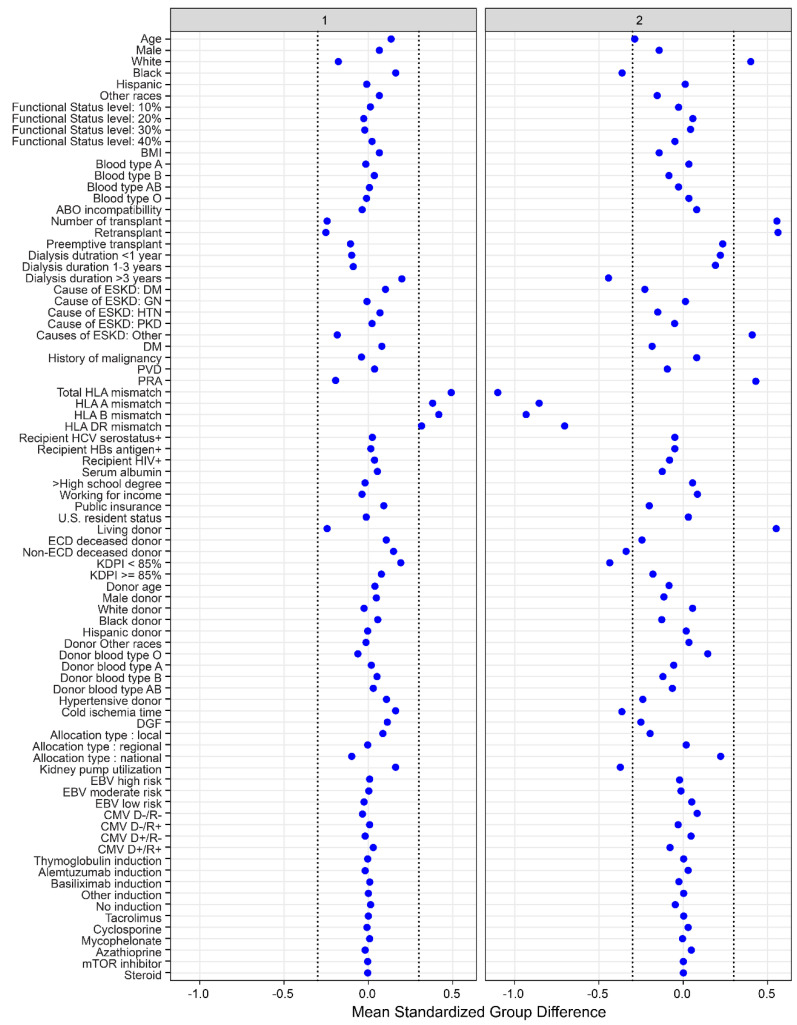
Figure 3.
The standardized differences across two clusters for each of baseline parameters. The x axis is the standardized differences value, and the y axis shows baseline parameters. The dashed vertical lines represent the standardized differences cutoffs of <−0.3 or >0.3. Abbreviations: BMI: Body mass index, CMV: Cytomegalovirus, D: Donor, DGF: Delayed graft function, DM: Diabetes mellitus, EBV: Epstein–Barr virus, ECD: Extended criteria donor, ESKD: End stage kidney disease, GN: Glomerulonephritis, HBs: Hepatitis B surface, HCV: Hepatitis C virus, HIV: Human immunodeficiency virus, HLA: Human leukocyte antigen, HTN: Hypertension, KDPI: Kidney donor profile index, mTOR: Mammalian target of rapamycin, PKD: Polycystic kidney disease, PRA: Panel reactive antibody, PVD: Peripheral vascular disease, R: Recipient.

