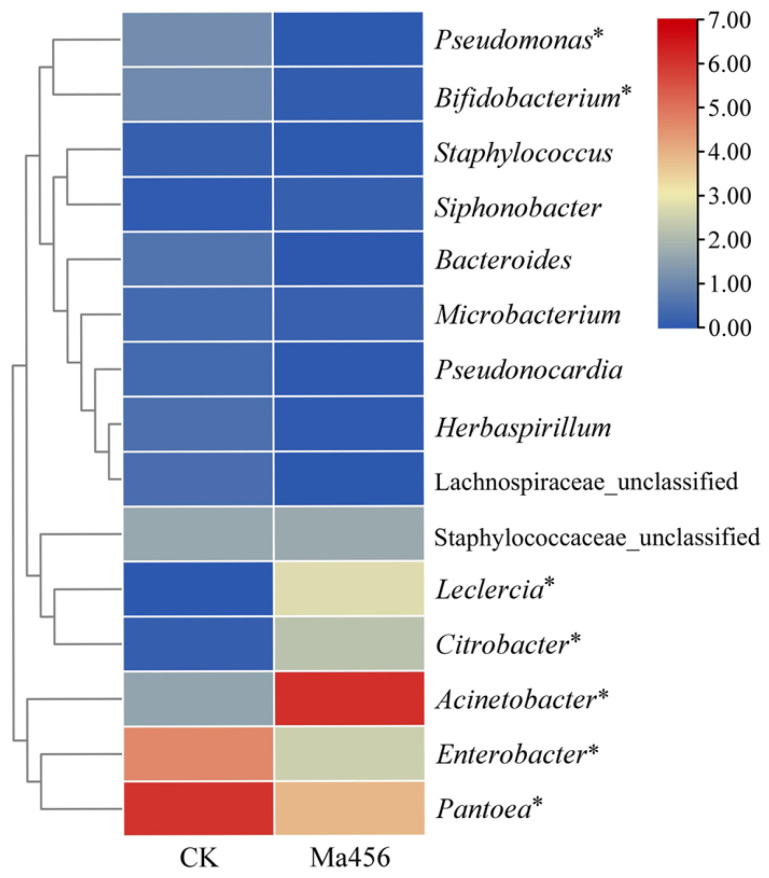
Figure 4.
Heatmap of the relative abundance of the top 15 predominant bacterial genera in the gut of BPH that were treated by fungal infection (Ma456) and 0.02% Tween 80 (CK). The color scale represents values of relative abundances (%) normalized by log2. Zero values were added as 1 and log2 transformed. Asterisked species differ significantly in the relative abundance between two BPH gut samples (p < 0.05).

