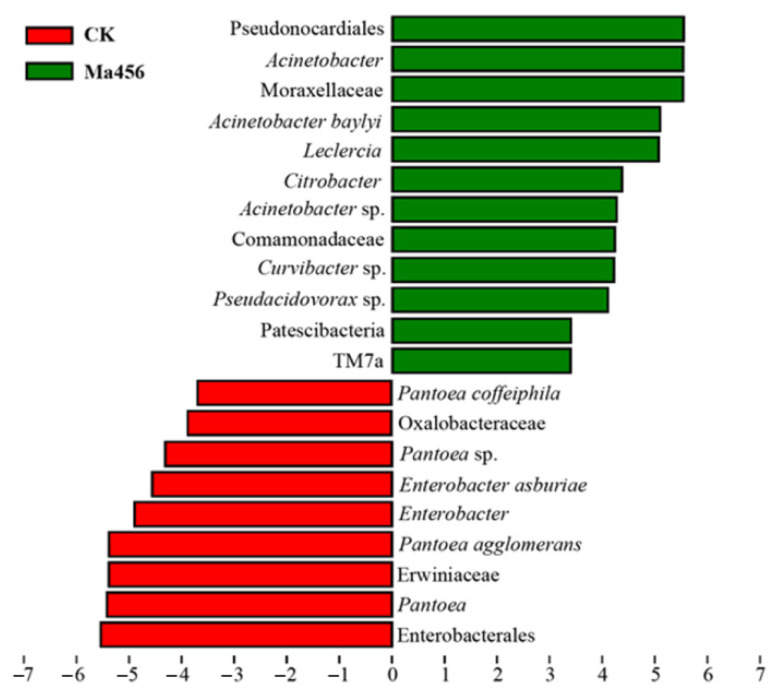
Figure 6.
Different structures of gut bacteria between the fungus-infected (Ma456) and 0.02% Tween 80-treated (CK) groups identified by LEfSe analysis with linear discriminant analysis (LDA) scores of 3.0. Differentially abundant taxa are represented by histograms with LDA scores (red, CK; green, Ma456).

