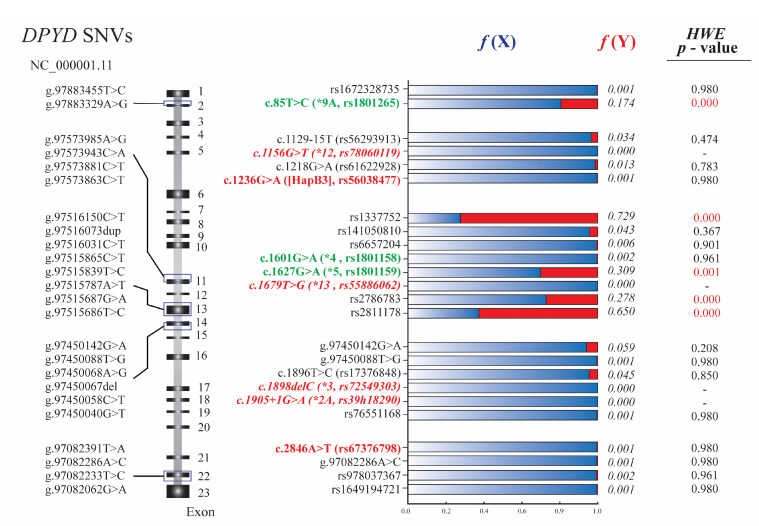
Figure 1.
Schematic representation of the five amplified regions and the genetic variants found in the DPYD gene. The schematic represents the exonic regions (black boxes) and intronic regions of the DPYD gene. The positions of all the genetic variants found in the genotyping are described. Variants described as nonfunctional (red and italics), decreased (red and bold), and fully functional (green) are highlighted. The stacked bar chart represents the allele frequencies for each loci, where the blue color shows the frequencies for the wild-type allele f(X) and the red bars for the minor allele f(Y). The p-values found in the HEW analysis are also detailed. All values showing significant differences are marked in red.

