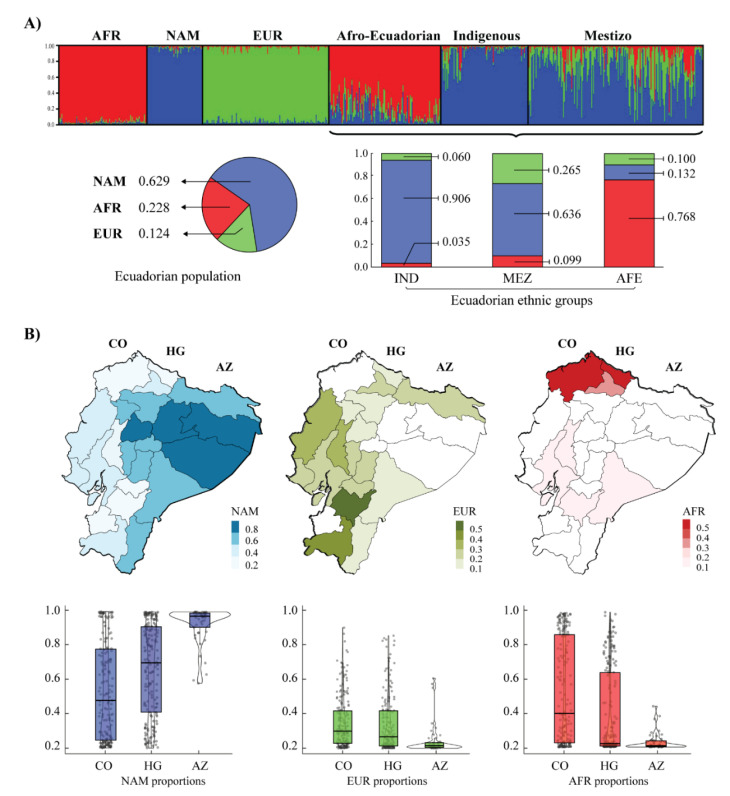
Figure 2.
Analysis of ancestry proportions of the Ecuadorian population through 46 AIM-INDELs. (A) STRUCTURE Bar plot of the composition of the Ecuadorian ethnic groups compared with the reference population (AFR: Africa, EUR: Europe, and NAM: Native America) (k = 3, assuming migration model). While the pie chart shows the ancestry proportions of the total population studied, the stacked bar chart shows the composition of the different Ecuadorian ethnic groups (AFE: Afro-Ecuadorian, MEZ: Mestizo, and IND: Indigenous). (B) Distribution of the ancestry proportion of reference populations throughout Ecuador. The percentages for NAM, EUR, and MEZ ancestry in the Ecuadorian individuals studied are detailed separately. The box plot shows the composition of these proportions for Ecuadorian groups from the Coast (CO), Andes (HG), and Amazon Region (AZ).

