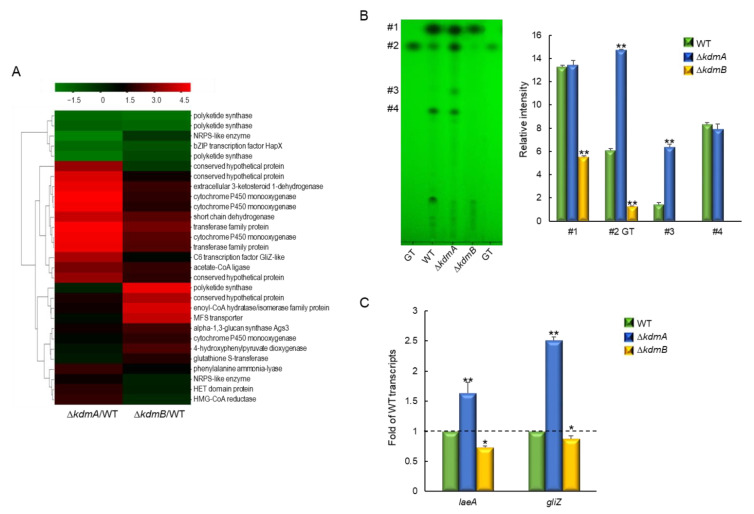
Figure 5.
Roles of KdmA and KdmB in the production of gliotoxin (GT) and other putative secondary metabolites. (A) Heatmap of altered expression levels of genes encoding secondary metabolite biosynthesis in mutant strains. (B) Determination of GT production and several secondary metabolites in the WT and mutant strains. Standard GT concentration was 10 μg (left side) and 5 μg (right side). Left: a representative thin-layer chromatogram of the culture supernatant of each strain extracted with chloroform. Right: a graph of relative intensities of individual chromatogram bands in culture supernatants from different strains. (C) RT-qPCR analysis of changes the laeA and gliZ gene expression levels in mutant strains compared to that in the WT strain. Dot line indicates the level of WT transcript. Statistical significance of differences between WT and mutant strains was assessed by Student’s t-test: * p < 0.05, ** p < 0.01.

