
Figure 3.
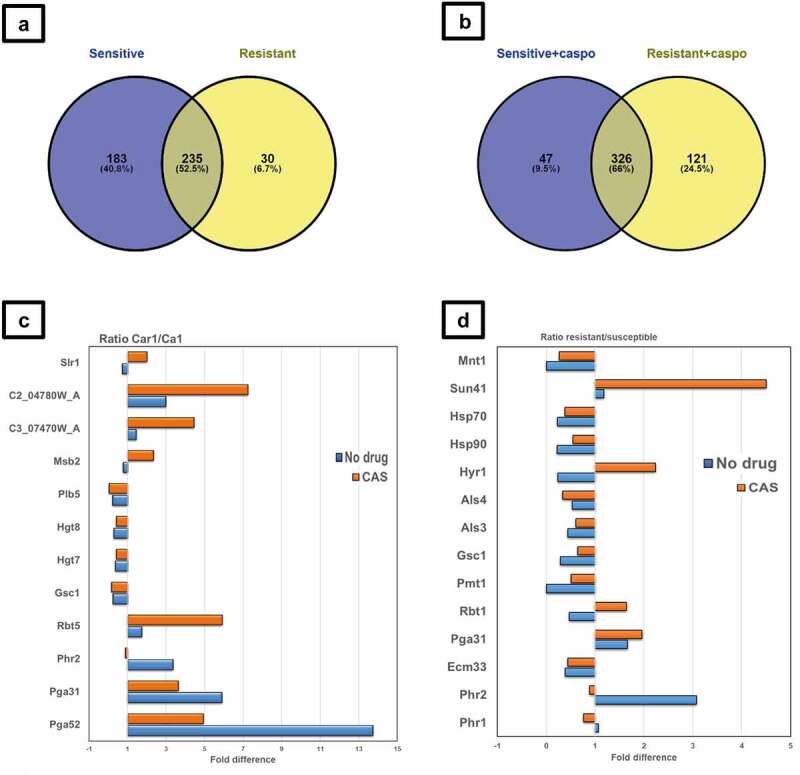
Proteomic analysis of cell wall fractions from C. albicans resistant and susceptible isolates exposed to caspofungin. (a, b) Total number of proteins identified by LC MS/MS in susceptible and resistant isolates in absence (a) and presence (b) of caspofungin in RPMI 1640 medium. (c) Differential expression of relevant proteins identified by LC MS/MS in susceptible Ca1 and resistant Car1 isolates in absence (blue) and presence (orange) of caspofungin in RPMI 1640 medium. The values displayed are the ratios of the averages (n=3) of the peak areas from the LC MS/MS analysis of the two isolates (Car1 and Ca1). The values displayed are the ratios of the log 10 of the averages of the peak areas from the LC MS/MS analysis of the two groups (resistant and susceptible). (d) Differential protein expression for the resistant compared to the susceptible isolates with (orange) and without (blue) caspofungin. The full list is available in File S1 in Supplementary Material. Venn diagrams were created using Venny software (n=1).