Figure 5a.

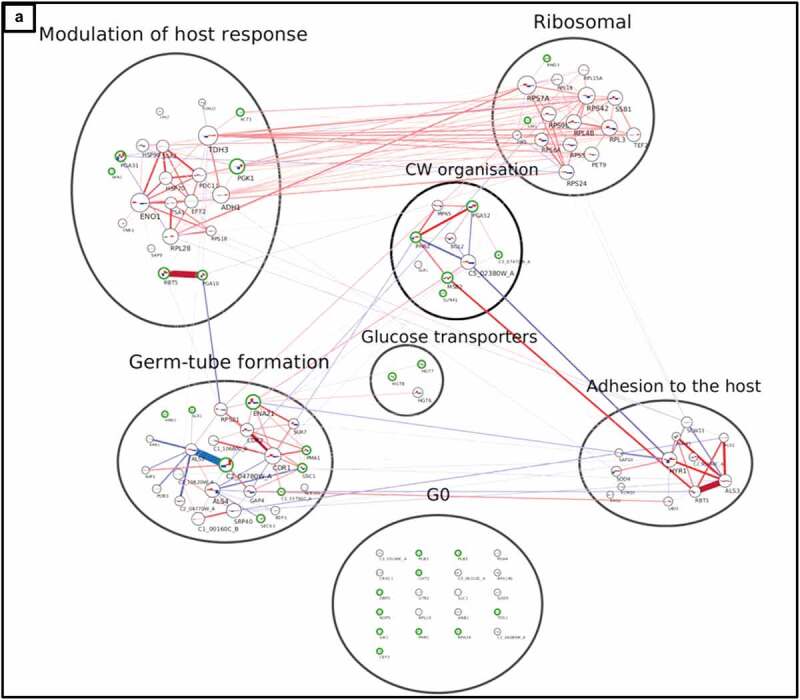
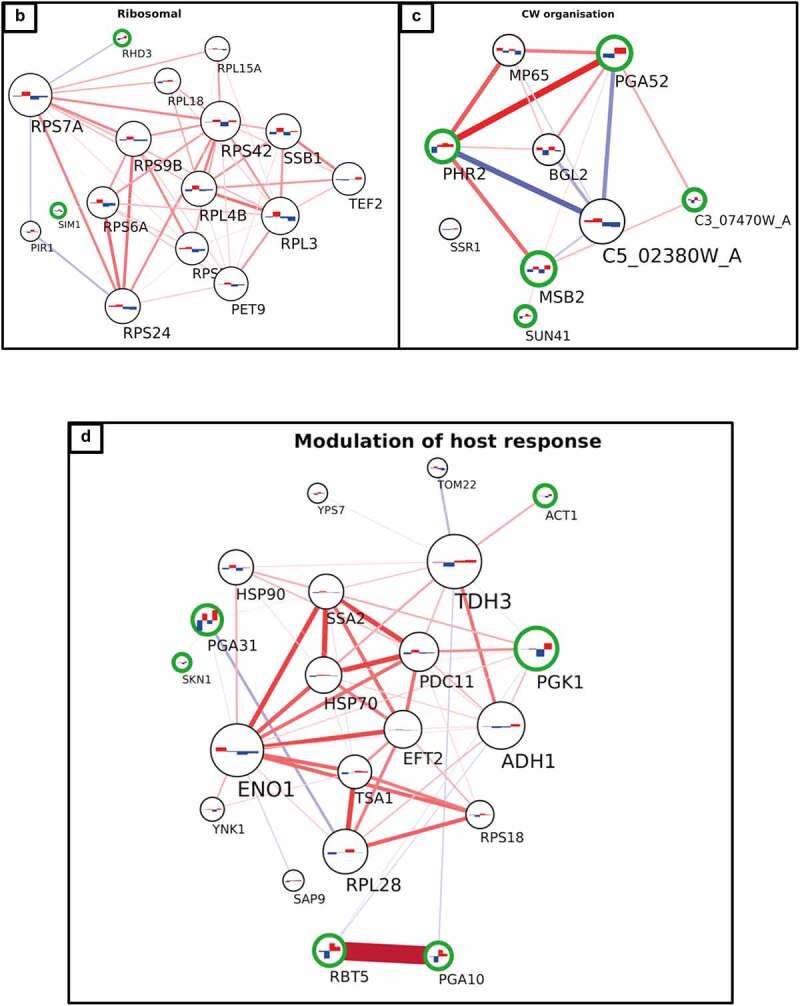
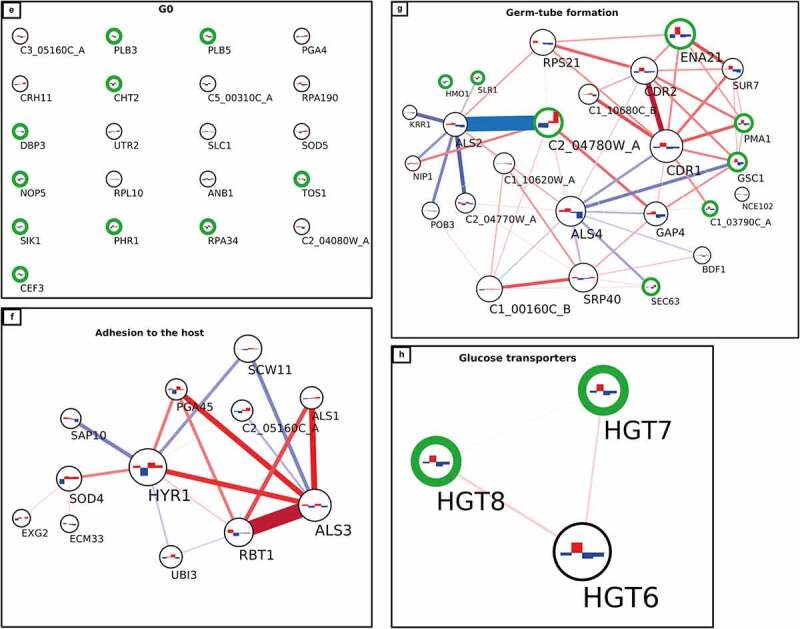
Interaction network of cell wall proteome from C. albicans isolates. The network was created using LC-MS/MS data from cell wall fractions of C. albicans isolates grown in absence and in presence of caspofungin. The green edges of the circles indicate the significant proteins for the DE analysis (adjusted p-value ≤0.1). The lines connecting the circles indicate the positive (red, both increase or decrease+/- caspofungin) or negative interaction (blue, one decreases and the other increases or vice versa). The thickness of the line indicates the strength of the interaction. The histograms inside the circles indicate the expression of the proteins related to the normalized average between the two groups of isolates in the two conditions: from left to right, the columns represent susceptible, susceptible+caspofungin, resistant, resistant+caspofungin. Proteins were clustered in seven groups and the GO analysis performed: (a) general view of the network; (b) ribosomal proteins; (c) cell wall organization; (d) modulation of the host response; (e) G0; (f) adhesion to the host; (g) germ-tube formation; (h) glucose transporters.
Figure 5b.

(continued).
Figure 5c.

(continued).
