Figure 2.

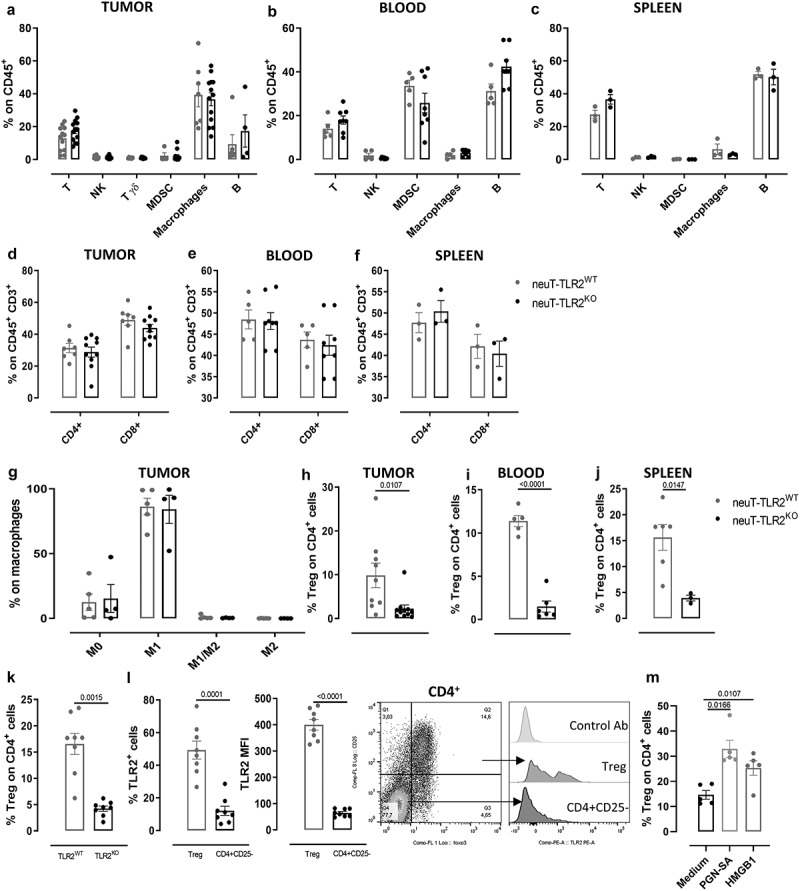
TLR2 deletion alters Treg cell frequency without affecting other immune populations. FACS analysis of immune cells in tumors (N ≥ 6 per group), blood (N = 5 neuT-TLR2KO and 6 neuT-TLR2WT) and spleens (N ≥ 3 per group) from neuT-TLR2KO and neuT-TLR2WT mice. Graphs show mean ± SEM of the percentage of (a-c) lymphocytes and myeloid cells from among CD45+ cells, (d-f) CD4+ and CD8+ from among CD3+ T cells, (g) M0, M1, M1/M2 and M2 from among total tumor macrophages, (h-j) Tregs from among CD4+ T cells. Each dot represents a mouse. (k) FACS analysis of peripheral Tregs in TLR2KO and TLR2WT mice. Graphs show mean ± SEM of the percentage of Tregs from among CD4+ T cells (N = 8 per group). (l) FACS analysis of TLR2 expression on Tregs and CD4+ CD25− cells from TLR2WT mice. Graphs show mean ± SEM of the percentage of TLR2+ cells and of TLR2 MFI (N = 8 per group). A representative density plot of Treg staining on CD4+ T cells and representative histograms of isotype control Ab or TLR2 staining on Treg and CD4+ CD25− effector T cells are shown. (m) FACS analysis of Tregs from TLR2WT mice upon ex vivo stimulation of blood T lymphocytes with TLR2 activating ligands. Graphs show mean ± SEM of the percentage of Tregs from among CD4+ cells. Each dot represents a mouse (N = 5 per group). Results come from at least 3 independent experiments. Unpaired Student’s t test with Welch’s correction.
