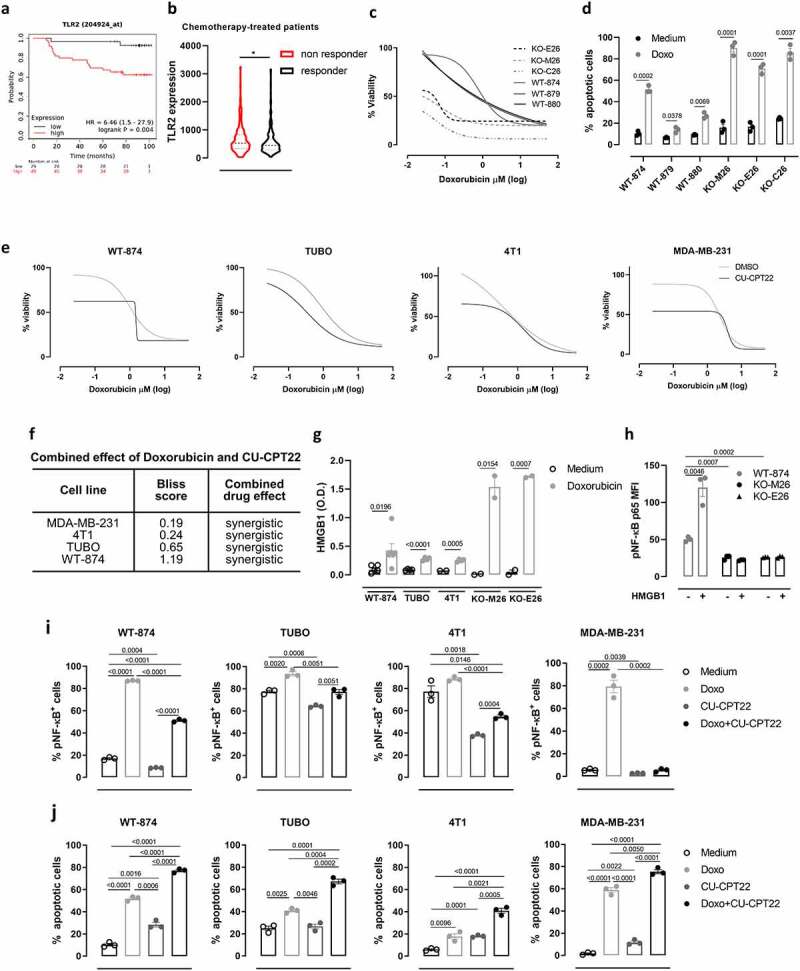
Figure 5.

TLR2 promotes BC resistance to doxorubicin. (a) Kaplan–Meier plots displaying 5-y RFS of chemotherapy-treated BC patients stratified according to TLR2 mRNA expression (N = 78). (b) TLR2 mRNA expression levels in the tumors from BC patients that relapsed (non-responders; N = 221) or not (responders; N = 256) within 5 y of adjuvant chemotherapy. (c) Concentration-dependent cytotoxicity of doxorubicin (50 to 0.02 µM) on WT-874, WT-879, WT-880, KO-M26, KO-E26 and KO-C26 cells, evaluated by MTT after 48 hours of treatment. The graph shows log(inhibitor) vs. response – variable slope (four parameters) non-linear regression of data from three independent experiments, calculated using GrapPad8 software. (d) WT-874, WT-879, WT-880, KO-M26, KO-E26 and KO-C26 cells were treated with doxorubicin for 48 hours and analyzed using Annexin-V/propidium iodide FACS staining. The graph shows means ± SEM of the % of Annexin-V+ from three independent experiments. (e) Concentration-dependent toxicity of doxorubicin (50 to 0.02 µM) alone or combined with 5 µM CU-CPT22 on WT-874, TUBO, 4T1 and MDA-MB-231 cells, evaluated via MTT after 48 hours of treatment in three independent experiments. (f) Analysis of the effect of the combination of doxorubicin and CU-CPT22 on BC cell lines. Bliss score > 0: synergistic effect; Bliss score = 0: additive effect; Bliss score < 0: antagonistic effect. (g) ELISA analysis of HMGB1 released into the supernatant by BC cells that were treated with doxorubicin for 48 hours or left untreated. The graph shows means ± SEM of HMGB1 concentration from ≥2 independent experiments. (h) FACS analysis of p65 NF-κB phosphorylation in WT-874, KO-M26 and KO-E26 cells treated with HMGB1 for 30 minutes or left untreated. The means ± SEM of mean fluorescence intensity (MFI) from three independent experiments are reported. (i, j) WT-874, TUBO, 4T1 and MDA-MB-231 cells were treated for 48 hours with or without doxorubicin, CU-CPT22 or a combination of both. (i) Graphs of FACS analysis of p65 NF-κB phosphorylation. (j) Annexin-V/propidium iodide analysis of cell apoptosis. All graphs report the means ± SEM of the percentage of positive cells from three independent experiments. Student’s t tests.
