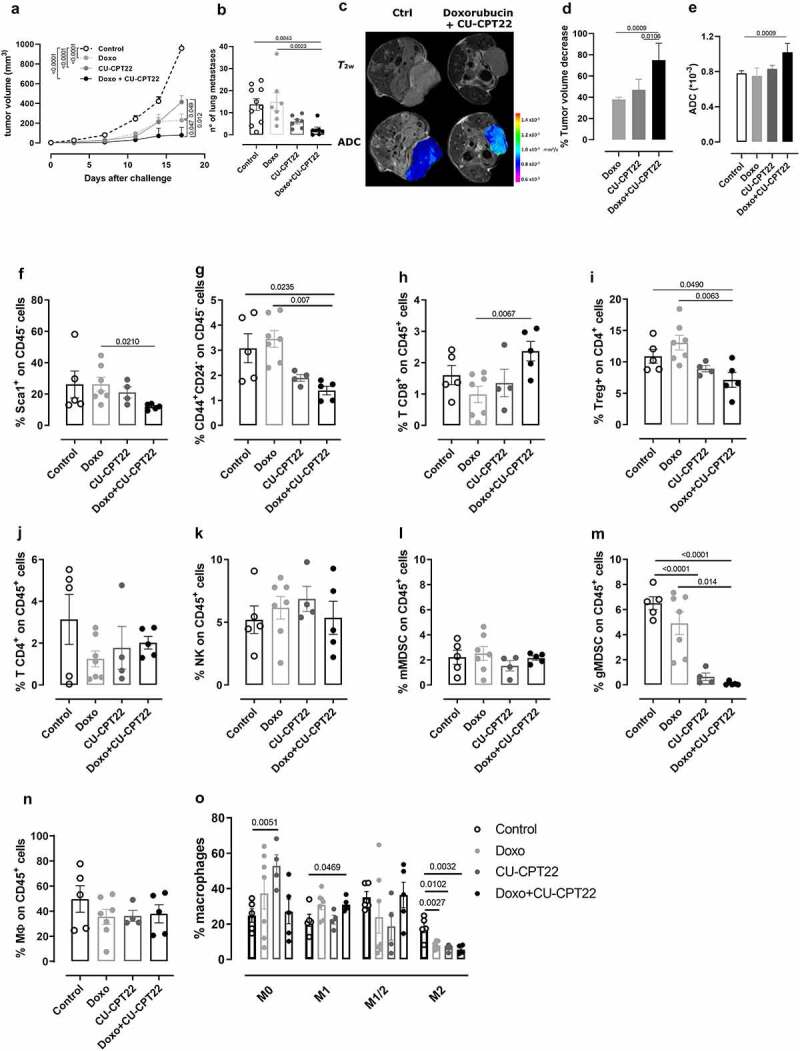
Figure 6.

TLR2 inhibition increases doxorubicin anti-cancer activity in vivo. BALB/c mice were orthotopically challenged with 1 × 10⁴ 4T1 cells. When the tumors reached 2 mm in diameter, the mice were treated i.p. with 3 mg/kg doxorubicin and intratumorally with 50 µg CU-CPT22, or the vehicle alone as a control (N = 7 per treated groups and N = 10 per control group). The treatment was repeated twice per week. Graphs show (a) mean tumor volume, and (b) the number of spontaneous lung metastases per square mm measured in lungs. (c-e) T2w and DWI axial MR images of mice were acquired at the end point of the treatment. (c) Representative T2w axial images and false color representative axial ADC maps of the tumor region (superimposed on morphological T2w MR images) of control and doxorubicin + CU-CPT22-treated mice. (d) Tumor volume was measured by manually drawing ROIs in the tumor for all axial slices covering the entire tumor (Fiji-ImageJ free software). Decrease of volume in the treated mice was reported as the percentage of the volume of control mice (mean ± SD). (e) Mean ± SD of ADC values from the tumors of treated mice. (f-o) FACS analysis of (f) Sca1+ and (g) CD44+ CD24− cells from among CD45−, (h) CD8+ T cells, (j) CD4 + T cells, (k) NK cells, (l) monocytic MDSCs, (m) granulocytic MDSCs, and (n) macrophages from among CD45+ leucocytes and (i) Tregs from among CD4+ T cells and (o) M1, M2, M1/M2 or M0 polarized macrophages among the macrophage population in the tumors. Graphs show means ± SEM of the percentage of positive cells (N ≥ 4). Each circle represents a mouse. Student’s t test or Mann–Whitney test. In (a), two-way ANOVA analysis.
