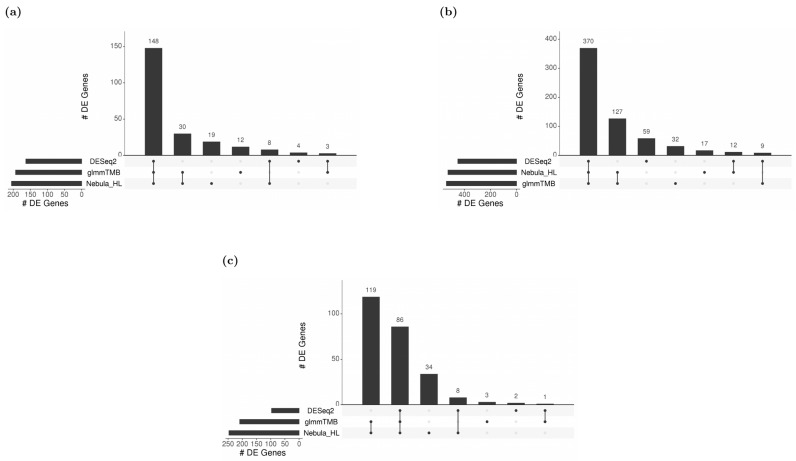
Figure 13.
Upset plots showing the overlap of real-data DEGs identified by three DE methods (DESeq2, Nebula HL, and glmmTMB) at FC 1.5 and FDR 0.05 cutoffs for Reyfman data [6]. Upset plot overlap is shown per cell type. (a) Overlap of DEGs for Alveolar macrophage cells; (b) Overlap of DEGs for AT2 cells; (c) Overlap of DEGs for SMC+ Fibroblast cells.

