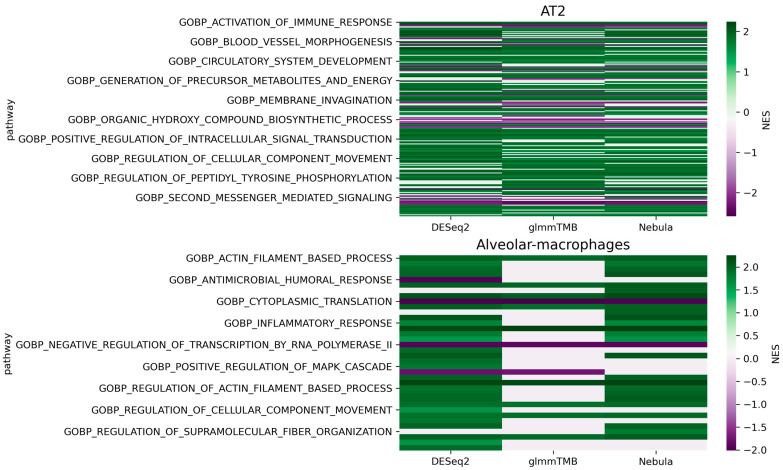
Figure 15.
Heatmap of the enriched GO terms (Reyfman Fibrosis data [6]). Color bar indicates normalized enrichment score (NES). Higher NES absolute value indicates more significant; NES = 0 indicates that pathway cannot be enriched. The more rows with NES = 0, the worse performance of the DEG method.

