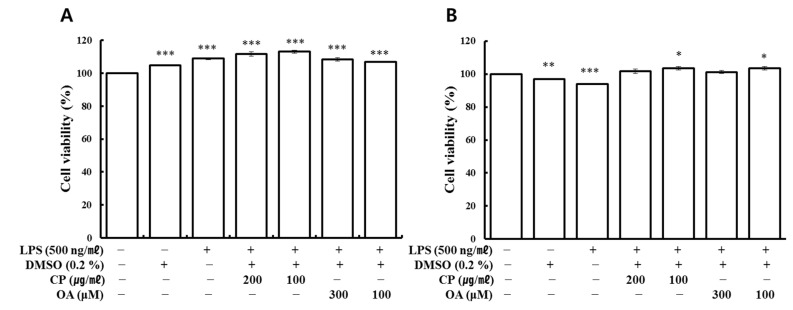
Figure 1.
Cell viability by WST assay. (A) LA4 and (B) MH-S cells were treated at the indicated concentrations of the test compounds for 24 h. Untreated cells (normal) were set to 100%. Cell viabilities are expressed as a percentage relative to the normal group. The data represent the mean ± SEM of triplicate determinations. * p < 0.05, ** p < 0.01, and *** p < 0.001 vs. the normal group.

