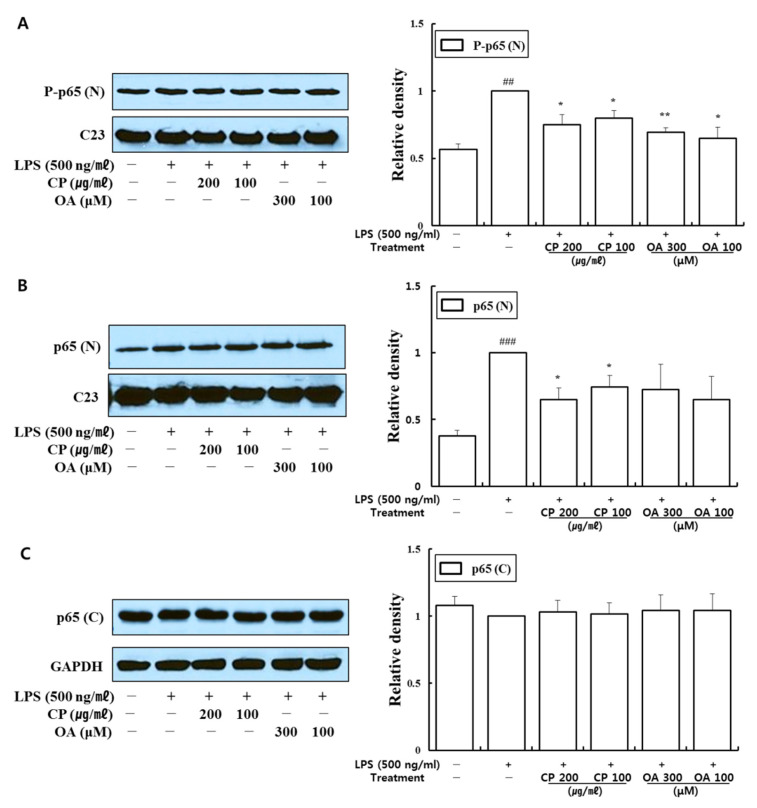
Figure 6.
Effects of CP and OA treatments on the cellular protein level of NF-kB p65 in LPS-stimulated LA4 cells. LA4 cells were stimulated with LPS for 1 h and then incubated with CP or OA treatments for 24 h. Each protein fractioned into nuclear (N) and cytosol (C) was determined by Western blot. C23 was used for (A) P-p65 (Ser536) and (B) p65, and GAPDH was used for (C) p65 as internal controls. The images shown are representative, and the densities of the bands were assessed by Image J. The data are expressed as the mean ± SEM; ## p < 0.01, ### p < 0.001 vs. the normal group; * p < 0.05 and ** p < 0.01 vs. the LPS-stimulated group. P-, phosphorylated.

