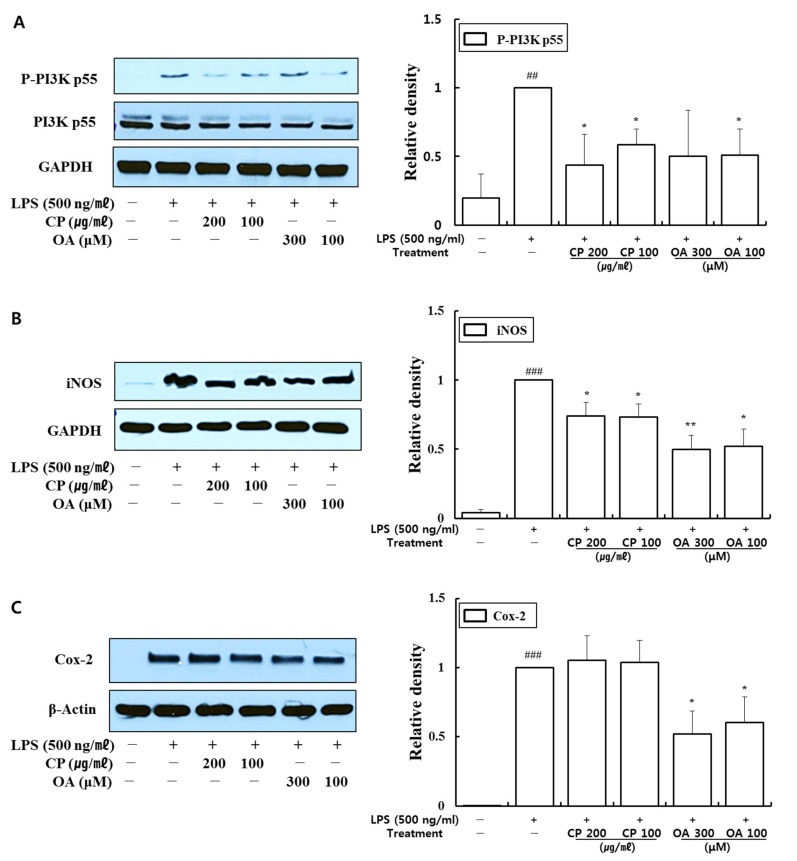
Figure 9.
Effects of CP and OA treatments on the cellular protein levels of PI3K, iNOS, and Cox-2 in LPS-stimulated MH-S cells. MH-S cells were stimulated with LPS for 1 h and then incubated with CP or OA treatments for 24 h. The proteins of (A) phospho-PI3K p55 (Tyr199), total PI3K p55, (B) iNOS, and (C) Cox-2 were determined by Western blot. The images shown are representative, and GAPDH and β-actin were used as internal controls. The densities of the bands were assessed by Image J. The results are presented as the mean ± SEM; ## p < 0.01, ### p < 0.001 vs. the normal group; * p < 0.05 and ** p < 0.01 vs. the LPS-stimulated group. P-, phosphorylated.

