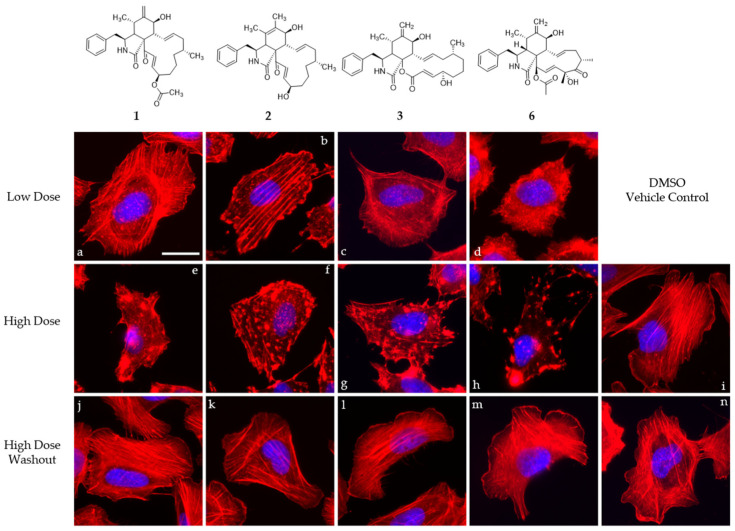
Figure 5.
Overlay images of immobilized U2-OS cells treated with different concentrations of compounds 1–3 and 6 (1: (a,e,j), 2: (b,f,k), 3: (c,g,l), and 6: (d,h,m)) normalized against their cytotoxicity against L929 cells for one hour (IC50; low dose, 1 × IC50 (a–d); high dose, 5 × IC50 (e–h)) and the corresponding high-dose washout experiment after one hour recovery time (j–m). Volume of the DMSO vehicle control was adjusted to the highest volume of DMSO used in the corresponding experiment (i,n). Cells were stained for their F-actin cytoskeleton using fluorescently coupled phalloidin (pseudocoloured in red) and nuclear DNA using DAPI (pseudocoloured in blue). Representative scale bar in image (a) correspond to 25 µm.

