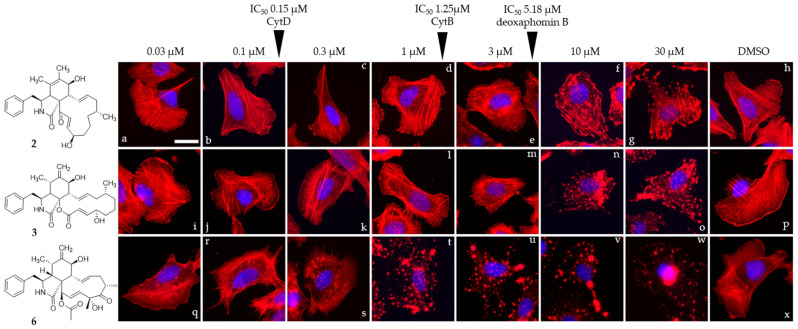
Figure 6.
Overlay images of immobilized U2-OS cells treated with a gradually increasing concentration (0.03–30 µM) of compounds 2, 3, and 6 (2: (a–g), 3: (i–o), and 3: (q–w)) for one hour. IC50 values determined against L929 cells are denoted with arrows. Volume of the DMSO vehicle control was adjusted to the highest volume of DMSO used in the corresponding experiment (h,p,x). Cells were stained for their F-actin cytoskeleton using fluorescently coupled phalloidin (pseudocoloured in red) and nuclear DNA using DAPI (pseudocoloured in blue). Representative scale bar shown in image (a) represent 25 µm.

