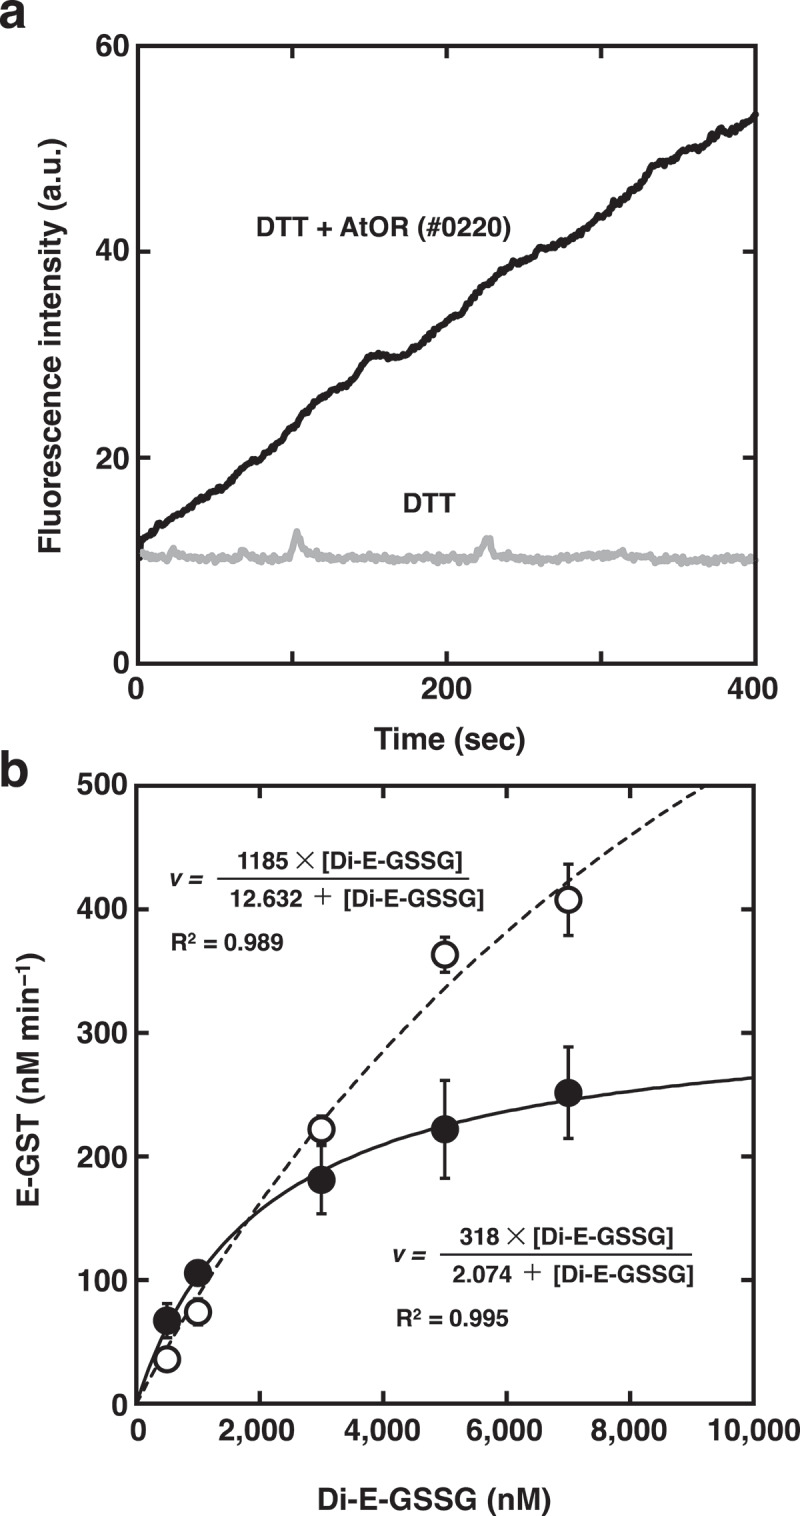
Figure 2.

PDR activity of AtOR protein. (a) Di-E-GSSG was incubated with DTT at 25°C in the presence (black line) or absence (gray line) of AtOR (#0213). The fluorescence was recorded with excitation at 525 nm and emission at 545 nm. (b) Michaelis-Menten curves for PDR kinetics with 5 µM DTT of AtOR (#0213)(open circles and broken line) and AtOR (#0220)(closed circles and solid line). AtOR and DTT were incubated with varying concentrations of Di-E-GSSG at 25°C, and initial rates of E-GSH formation were monitored as a function of the concentration of Di-E-GSSG. Values represent the mean ± S.D. (n= 3).
