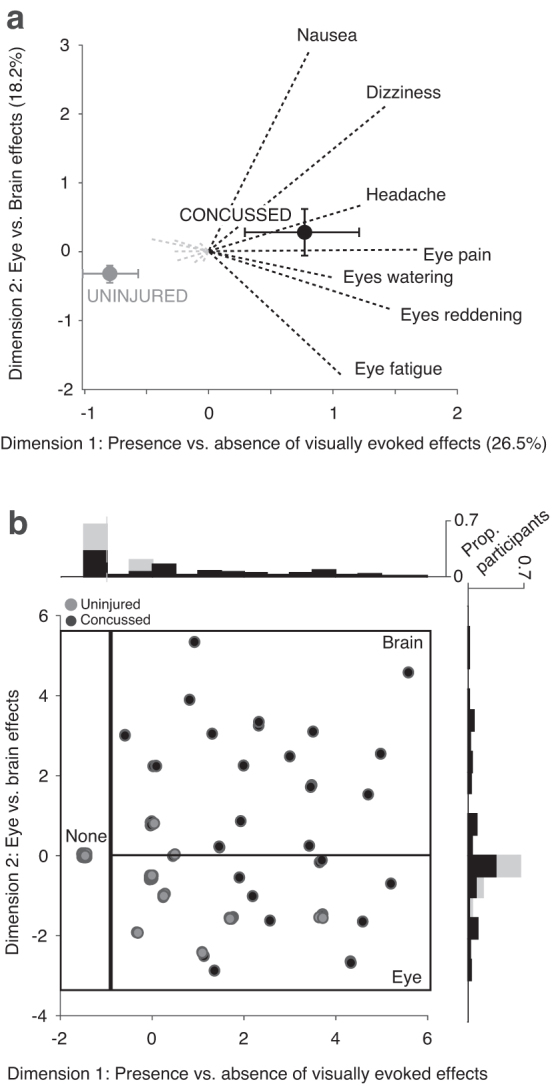
FIG. 1.

Multiple correspondence analysis (MCA) for visually evoked effects for uninjured and concussion groups. (a) MCA of visually evoked effects. Factor loadings represent the geometric distance between the presence (dotted black line) or absence (dotted gray line) of individual visually evoked effects, with 0 representing the midpoint of variation. Dimension 1 represents the absence (negative direction) or presence (positive direction) of visually evoked effects, and dimension 2 divides eye-related effects (negative direction) and brain-related effects (positive direction). Mean MCA factor loadings are shown for uninjured (gray) and concussed (black) youth. Error bars represent 95% confidence intervals by bootstrap analysis. (b) Dimension 1 and dimension 2 coefficients for individual uninjured (gray) and concussed (black) youth. Because a finite number of factor loadings are possible given the limited number of visually evoked effects, many of the individual participants overlap. This is captured by jittered data points and histograms depicting the proportion of participants with a given factor loading for dimension 1 (x-axis) and dimension 2 (y-axis). Boxes represent visually evoked effects categories.
