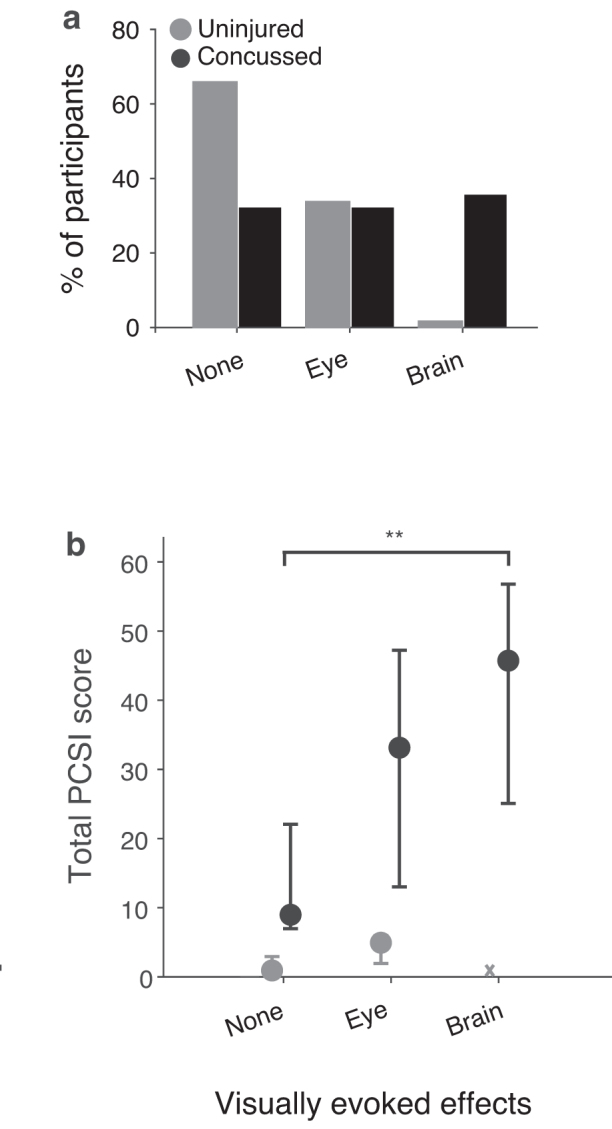
FIG. 2.

(a) Comparison of % of uninjured (gray) and concussed (black) youth by visually evoked effects category. (b) Median total Post-Concussion Symptom Inventory (PCSI) values by visually evoked effects category for uninjured and concussion youth. Error bars represent 95% confidence intervals by bootstrap analysis. “X” indicates the single uninjured participant in the brain-predominant effects category. Multiple comparisons using the Tukey method found a significant difference in total PCSI scores between no effects and brain-predominant effects categories (**p = 3.0e−4).
