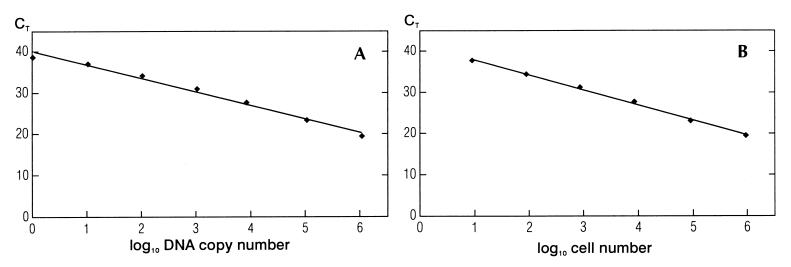
FIG. 2.
(A) 5′-nuclease PCR analysis of serial 10-fold dilutions of C. jejuni DNA. CTs are plotted against the calculated copies of bacterial DNA, i.e., a 10-fold dilution of the bacterial DNA (1.04 × 10⁶ copies/μl). The straight line, which was calculated by linear regression [y = −3.27x (number of cells) + 40.10], shows a square regression coefficient (R2) of 0.988. (B) 5′-nuclease PCR analysis of serial 10-fold dilutions of C. jejuni cells. CTs are plotted against the number of cells of C. jejuni. Template DNA was extracted from samples of cells containing serial 10-fold dilutions from approximately 4.2 × 10⁷ CFU of C. jejuni. The straight line, which was calculated by linear regression [y = −3.66x (number of cells) + 41.54], shows a square regression coefficient (R2) of 0.997.

