Figure 1.

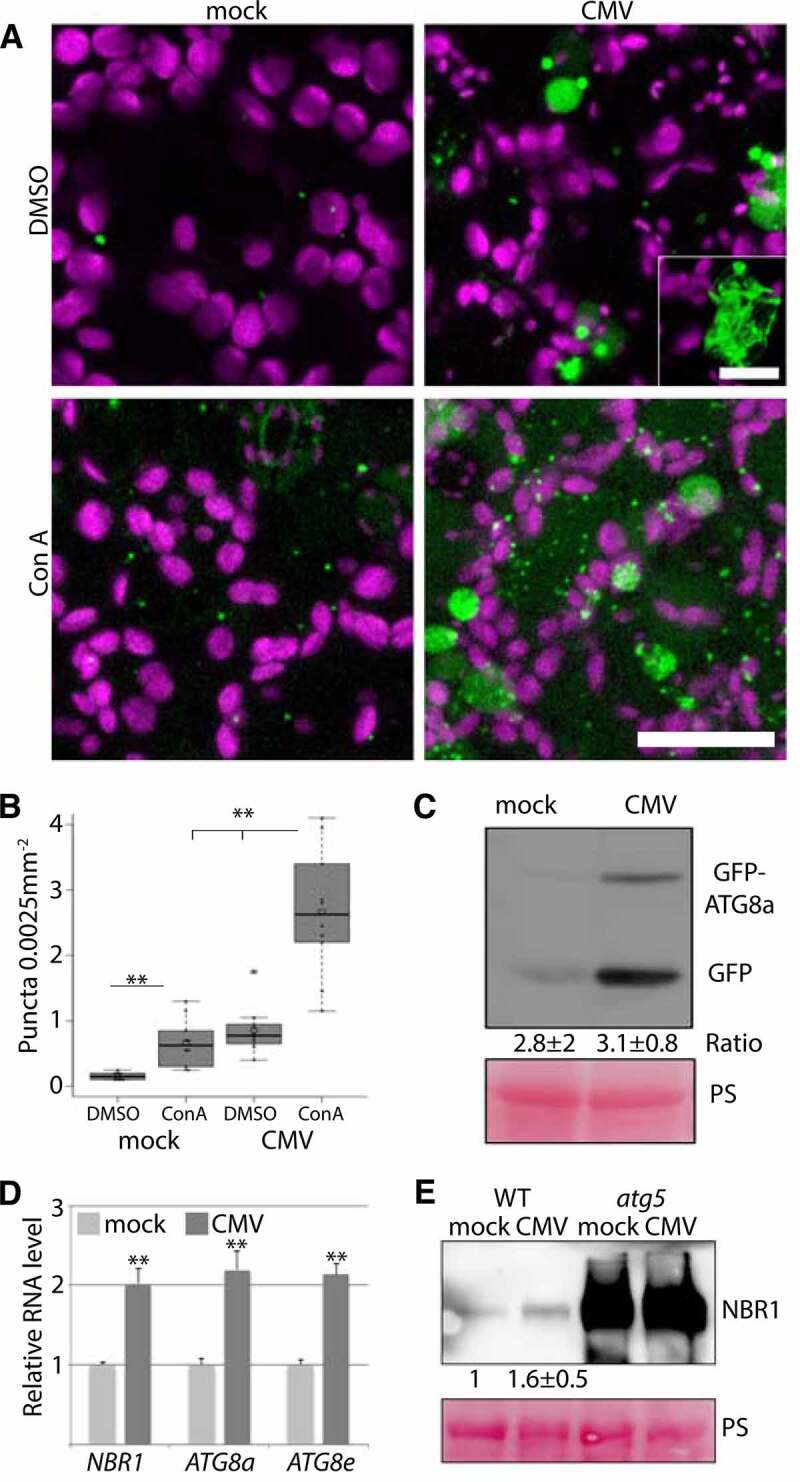
Autophagy is induced during CMV infection. (A) Representative images of the GFP-ATG8a marker in healthy and CMV infected plants with and without concanamycin A (ConA) treatment. Chloroplasts are shown in magenta. Images are confocal Z-stacks. Scale bar: 20 μm. The inset shows a representative of large irregular GFP-ATG8a structures found with CMV. Scale bar: 5 μm. (B) GFP-ATG8a foci were counted from similar images as in (A) using ImageJ. (n= 10). (C) Western blot analysis of free GFP levels derived from GFP-ATG8a in mock and CMV infected plants. Ponceau S (PS) staining verified comparable protein loading. The average and standard deviation from a quantification of the ratio between fusion to free GFP using ImageJ is shown below the western blot, and is based on four independent experiments. (D) Transcript levels for NBR1, ATG8a and ATG8e in mock and CMV infected plants were determined by RT-qPCR. (n= 4). (E) Representative western blot of NBR1 levels in mock and CMV inoculated WT and atg5 plants. Ponceau S (PS) staining verified comparable protein loading. A quantification of NBR1 protein levels using ImageJ from three independent western blots normalized using PS stained Rubisco is shown below the western blot. Statistical significance (*P < 0.05; **P < 0.01) was revealed by Student´s t-test (compared to WT).
