
Figure 3.
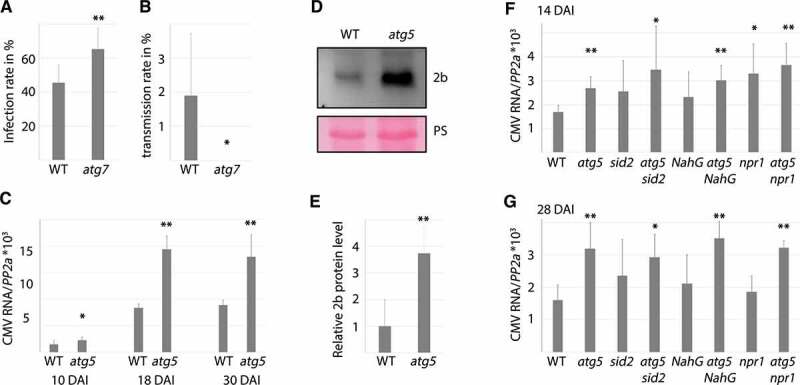
Autophagy impacts various aspects of CMV resistance. (A) CMV infection rate in WT and atg7 plants determined by presence/absence of viral symptoms three weeks after mechanical sap inoculation (8 independent replicates of 9 plants). (B) Vertical transmission of CMV in seeds from infected WT and atg7 plants was estimated by RT-PCR from 10 pools of 20 seedlings per plant (n= 5 independent plants). (C) CMV RNA levels relative to PP2A in WT and atg5 plants determined by RT-qPCR at 10, 18 and 30 DAI (n= 4). (D) A representative western blot of CMV 2b protein levels from infected WT and atg5 plants. Ponceau S (PS) staining verified comparable protein loading. (E) Four independent western blots as in (D) were used for quantification of 2b levels in infected WT and atg5 plants using ImageJ. PS-stained Rubisco was used to normalize loading. (F and G) Relative CMV RNA levels were determined by RT-qPCR at 14 (F) and 28 (G) DAI in WT, atg5, sid2, atg5 sid2, NahG, atg5 NahG, npr1 and atg5 npr1 plants. (n= 4). Statistical significance (**P < 0.01, *P < 0.05) was revealed by Student´s t-test.