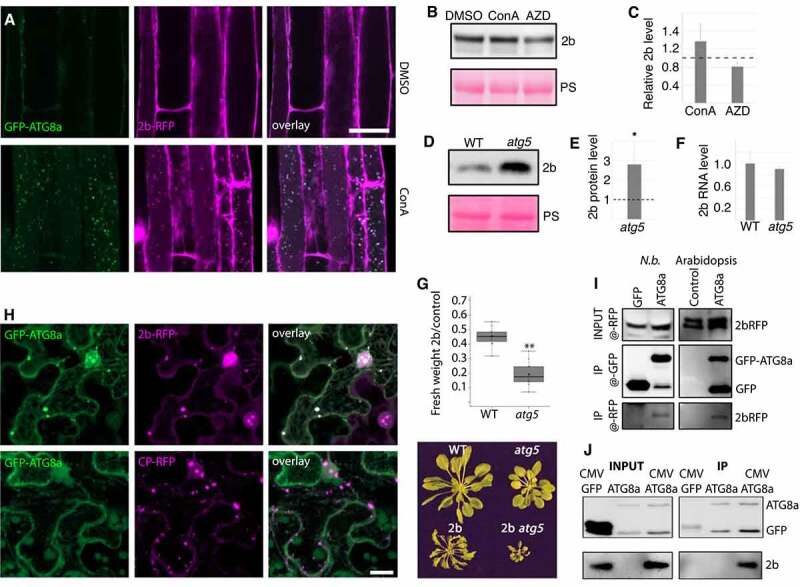
Figure 4.

Autophagy degrades 2b within and outside of the infection context. (A) Colocalization analysis of GFP-ATG8a and 2b-RFP in roots of transgenic Arabidopsis after DMSO and ConA treatment for 6 h. (B and C) 2b-RFP transgenic seedlings were treated with DMSO (control), ConA or AZD for 12h followed by western blot detection of 2b using anti-RFP. Ponceau S staining shows loading. Representative blot is shown in (B) and a quantification of 2b levels relative to PS stained Rubisco using ImageJ from three independent experiments with the dashed line indicating DMSO levels (C). (D and E) Accumulation of 2b in transgenic WT and atg5 plants was analyzed by western blotting. Representative blot is shown in (D) with PS-stained Rubisco indicating loading. Quantification of 2b levels using ImageJ from three independent experiments with the dashed line indicating WT levels (E). (F) Expression levels of the 2b transgene in WT and atg5 backgrounds related to (D and E) was determined by RT-qPCR. (n= 4). (G) 2b-dependent virulence measured as relative fresh weight loss caused by transgenic 2b expression compared to non-transgenic plants in WT and atg5 backgrounds. (n= 9). A representative plant image is shown below. (H) Colocalization analysis in N. benthamiana leaves co-expressing 2b-RFP or CP-RFP with GFP-ATG8a. The Z-stack images were acquired 48 h post agroinfiltration. Scale bar: 20 μm. (I) Co-IP (Co-immunoprecipitation) analysis of 2b-RFP with GFP-ATG8a from N. benthamiana (N.b.) and Arabidopsis. Co-expression of GFP was used as control in N. benthamiana and 2b-RFP expression alone in Arabidopsis. Shown is the anti-RFP input signal, as well as anti-GFP and anti-RFP signals from the GFP-based IP samples. (J) Co-IP analysis of 2b with GFP-ATG8a from infected Arabidopsis plants. Non-infected GFP-ATG8a and infected GFP expressing plants were used as control. Shown are the input and IP samples probed with anti-GFP and anti-2b.
