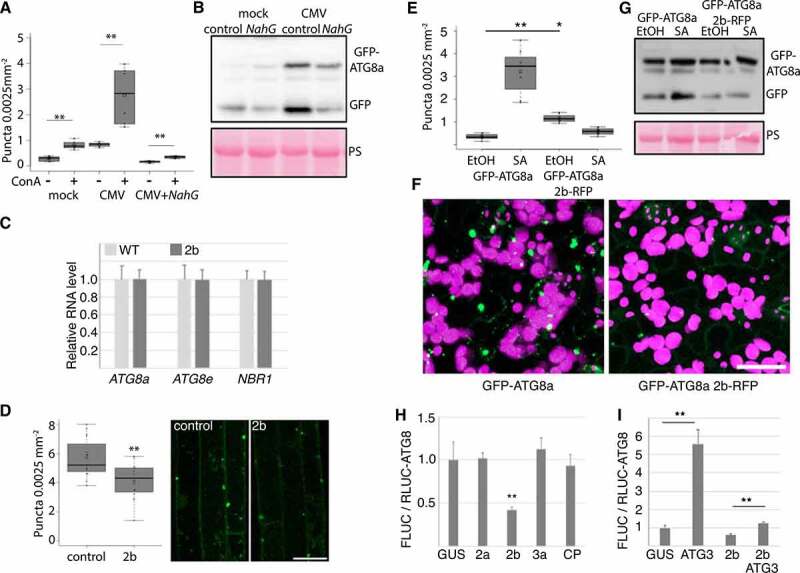
Figure 5.

CMV protein 2b dampens SA-induced autophagy. (A) GFP-ATG8a foci were counted from mock and CMV infected GFP-ATG8a and GFP-ATG8a NahG plants after ConA and DMSO treatment using ImageJ (n= 10). (B) Western blot analysis of GFP-ATG8a from mock and infected control and NahG plants. The experiment was repeated twice. (C) Transcript levels of ATG8a, ATG8e and NBR1 were determined by RT-qPCR from 2b transgenic plants shown in (Figure 4G) (n= 4). (D) The number of GFP-ATG8a foci were analyzed in roots of 10 days old seedlings without and with stable expression of 2b after 10 h ConA treatment. Counting was performed using ImageJ on confocal Z-stack projections (n= 15). Representative images are shown with scale bar: 20 μm. (E) Short-day grown 4-week-old GFP-ATG8a and GFP-ATG8a expressing 2b-RFP plants were sprayed with 1 mM SA. GFP-ATG8a foci were quantified 12 h later using confocal imaging and ImageJ software. Control plants were sprayed with corresponding 0.1 % EtOH (n= 9). (F) Representative images of GFP-ATG8a 12 h after SA treatments in control and 2b-RFP plants. Shown is GFP in green and chloroplasts in magenta. Scale bar: 20 μm. (G) SA-induced free GFP release from GFP-ATG8a was analyzed in control and 2b-RFP plants by western blot using anti-GFP. The western blot experiment was repeated twice with similar results. PS staining of the membrane was used to verify loading. (H) RLUC-ATG8a activity was analyzed after co-expression with CMV proteins and GUS control in N. benthamiana leaves at 3 DAI. FLUC was used as an internal control for RLUC activity, and the quantitative data is presented as a ratio of FLUC to RLUC-ATG8a (higher ratio = increased ATG8a degradation). n= 4. (I) As (H), but co-expressed proteins were combinations of 2b and Arabidopsis ATG3 as indicated. Statistical significance (**P < 0.01) was revealed by Student´s t-test.
