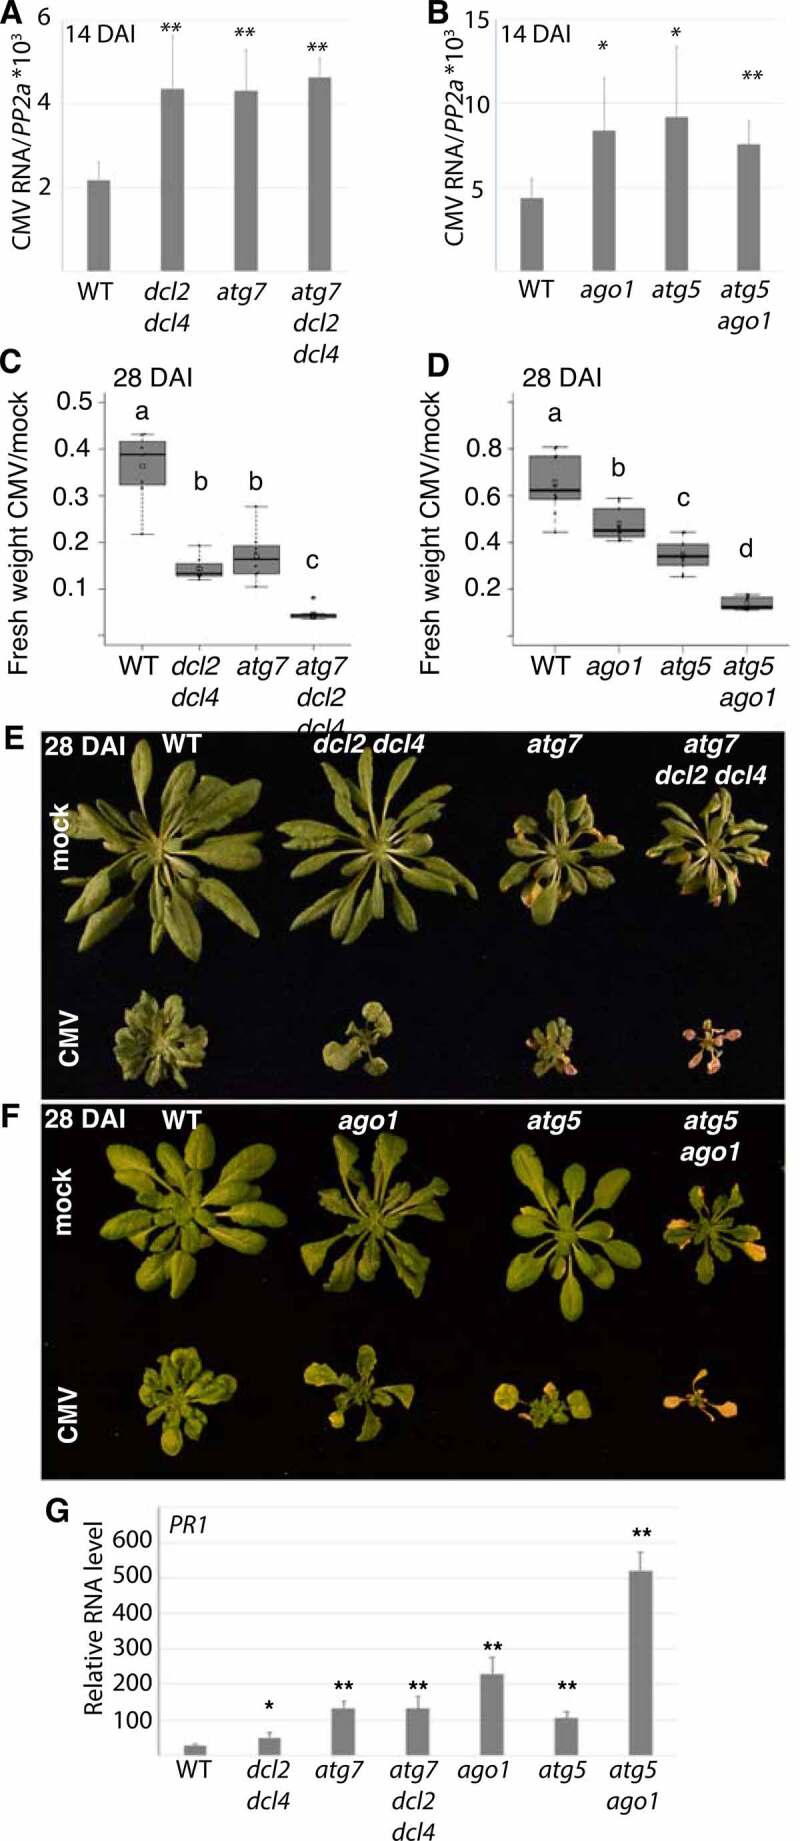
Figure 6.

Autophagy-enhanced CMV resistance involves RNA silencing and is uncoupled from disease symptom tolerance. (A) CMV RNA levels relative to PP2A were determined by RT-qPCR at 14 DAI in WT, atg7, dcl2 dcl4 and atg7 dcl2 dcl4 plants (n=4). (B) CMV RNA levels relative to PP2A were determined by RT-qPCR at 14 DAI in WT, atg5, ago1 and atg5 ago1 plants (n= 4). (C) and (D) The relative fresh weight of CMV infected plants compared to mock were determined in the same genotypes as in (A) and (B) at 28 DAI. (n=10). Representative images of mock and CMV infected plants at 28 DAI are shown to the right (E) and (F). (G) PR1 transcript levels were analyzed in the indicated genotypes using RT-qPCR at 18 DAI with CMV (n= 4). Statistical significance (**P < 0.01, *P < 0.05) was revealed by Student´s t-test. Letters indicate genotypes with statistically different levels (ANOVA P < 0.05, Tukey-HSD test).
