
Table 1.
LUS score, corresponding image, and description of image.
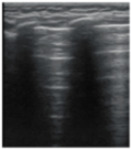
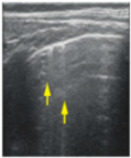
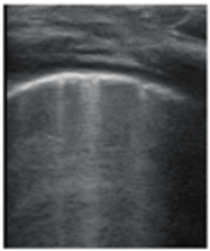
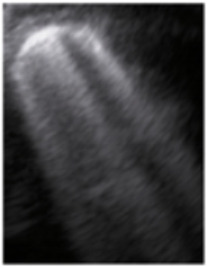
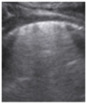
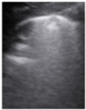
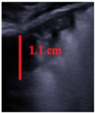
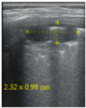
| LUS Score | 0 | 1 | 2 | 3 |
|---|---|---|---|---|
| Corresponding image |
|
|
|
|
| Description of images | Physiological A-lines (upper image) One or two B-lines per intercostal space (marked with yellow arrows) with smooth pleural line (lower image) |
More than two B-lines per intercostal space with irregular or thickened pleura | Coalescent/confluent B-lines (upper image)/‘white lung’ or small subpleural consolidations (<1 cm—lower image) | Large consolidations (>1 cm) ± air bronchogram—the image is from a newborn not include in the study with bacterial pneumonia |