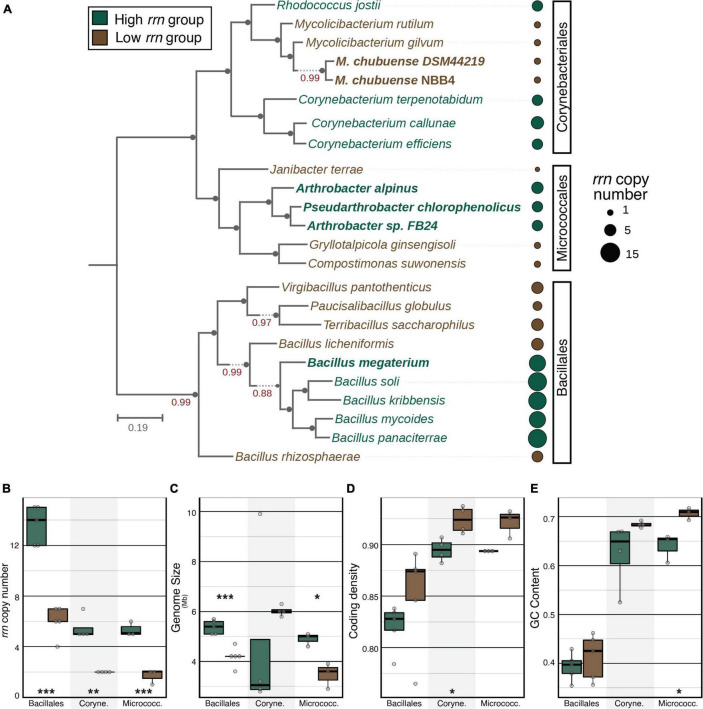
FIGURE 1.
Phylogenetic tree and genomic features of 24 isolates. Detailed information is summarized in Supplementary Table 1. (A) A maximum-likelihood phylogenetic tree constructed from a multi-locus sequence alignment using “Insert Set of Genomes into Species Tree” in KBase. Bold isolates denote their genomes had 100% 16S rRNA similarity to an amplicon sequence variant detected in soil samples. For each phylogenetic order, tree leaves and annotation dots are colored based on order-specific rrn copy group. The size of each dot is scaled by absolute rrn copy number present in each genome. (B) Within each phylogenetic order, isolates from high vs. low rrn groups had significant differences in rrn copy number. High and low rrn copy groups also differed according to (C) genome size, (D) coding density, and (E) GC content. Asterisks denote statistically significant differences between high and low rrn copy groups within each phylogenetic order according to a Student’s t-test (*p ≤ 0.05, **p ≤ 0.01, and ***p ≤ 0.001).

