FIGURE 3.
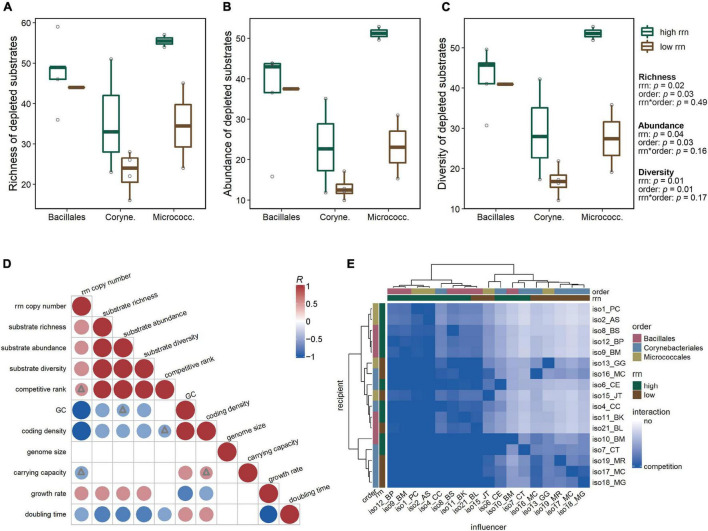
Substrate utilization and competition potential. Differences in substrate utilization among taxonomic and rrn copy groups reflected by (A) the richness, (B) abundance, and (C) diversity of substrates used by each isolate. All three substrate utilization metrics were significantly affected by rrn copy group and taxonomic group (ANCOVA, p < 0.05). (D) Pearson correlation coefficients (R) between isolate substrate utilization metrics, predicted competitive ranking, genomic features, and estimated growth parameters. Positive correlations are displayed in red and negative correlations in blue. Color intensity and size of the circles are proportional to the correlation coefficients. Circles without triangles represent significance level p < 0.05; triangles represent 0.05 < p < 0.1. For insignificant correlations (p > 0.1), the correlation coefficients are left blank. (E) Heatmap of directional pairwise competitive interaction strengths, predicted based on overlap in substrate utilization profiles. In heatmap color bar, label “no” represents no overlap in substrate use profiles, predicting no competition between isolates; darker blue color represents higher similarity in substrate use, predicting a higher potential that the influencer will compete with the recipient for resources.

