FIGURE 4.
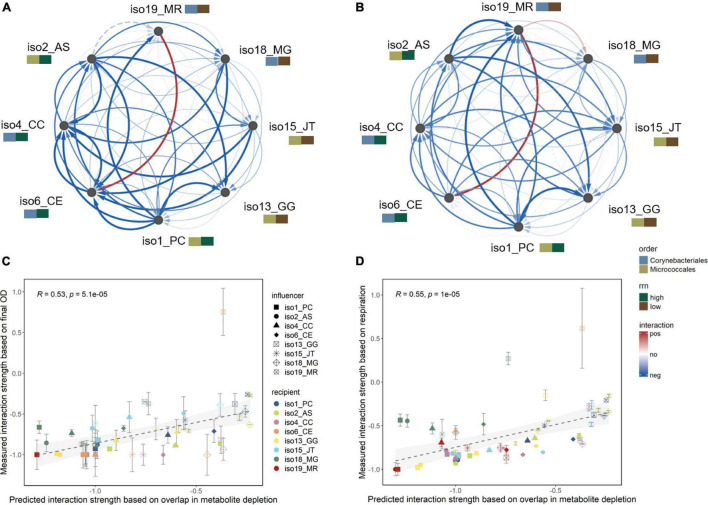
Directional pairwise interaction strengths. Measured interaction strengths from sequential growth experiments based on (A) final OD and (B) cumulative CO2 respiration results, shown as directed networks visualized in Cytoscape. Isolates are annotated by their phylogenetic order and order-specific rrn groups. Edge width and color correspond to mean relative fold change of the growth of recipient isolate (target node) in the spent medium of influencer isolate (source node) as compared with soil defined medium (n = 3). Red or blue represents increased or decreased growth, indicating positive or negative interaction, respectively. Insignificant interactions (p > 0.05, one-way ANOVA with post hoc Dunnett’s test) are shown in dashed edges. Results of individual replicates and correlation between the two interaction measures are shown in Supplementary Figure 4. Linear correlations between the predicted (Figure 3E) and measured significant interaction strengths based on (C) final OD and (D) cumulative respiration. Error bars represent standard deviations (n = 3). Correlation results for each individual recipient isolate are shown in Supplementary Figures 6,7.

