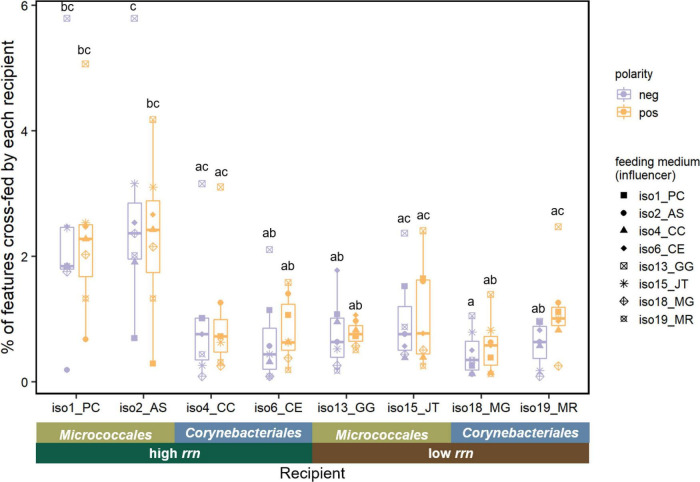
FIGURE 5.
Percentage of LC-MS features cross-fed by each recipient isolate. Significant differences denoted using letters (p < 0.05, one-way ANOVA with post hoc Tukey HSD test). n = 7 for each recipient isolate under each ionization mode. Each data point represents the percentage of positive or negative features depleted by a recipient isolate grown on the spent medium of an influencer (corresponding to different shapes listed in the legend). An ANCOVA revealed that taxonomic group and its interaction with rrn copy group both had significant effects on the percentage of cross-feeding features depleted by the recipient isolate, under both polarities as well as the average result (p < 0.05). Feature count results can be found in Supplementary Table 5.

