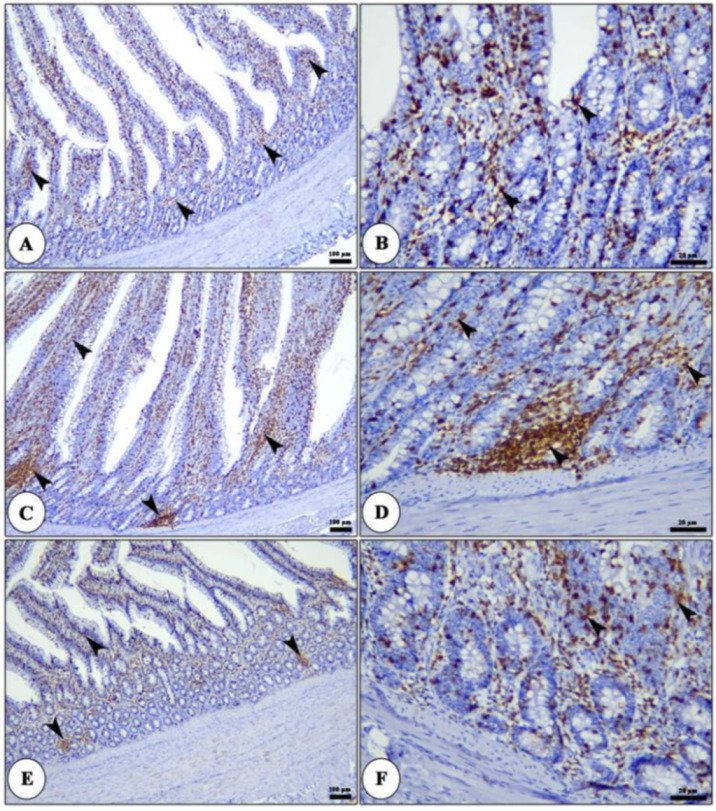
Figure 2.

Photomicrograph of CD3 immune staining of duodenum of broiler chickens of control (panel (A,B)), 0.4 gm/L (panel (C,D)), and 0.8 gm/L (panel (E,F)) licorice acid groups showing CD3 +ve cells in the form of diffuse T lymphocytes in the lamina epithelial and lamina propria and/or lymphatic nodules in the lamina propria (arrowheads).
