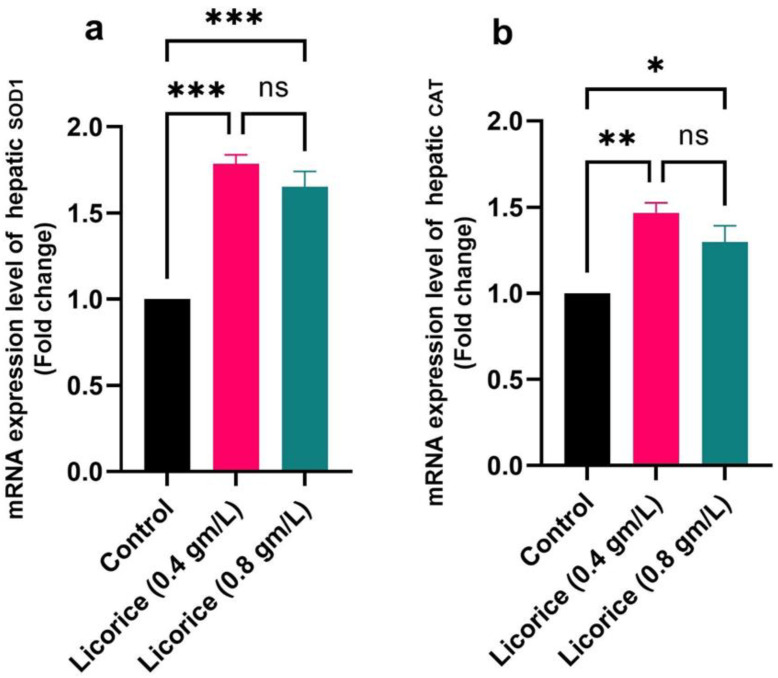
Figure 5.
Effect of licorice acid treatment (0.4 and 0.8 gm/L) on hepatic mRNA expression of SOD1 (a), CAT (b). The data are represented as the mean ± SE. *, ** and *** indicate p-value < 0.05, p-value < 0.01, and p-value < 0.001 respectively. ns: non-significant. (ANOVA with Dunnett’s multiple comparison test).

