Figure 7.
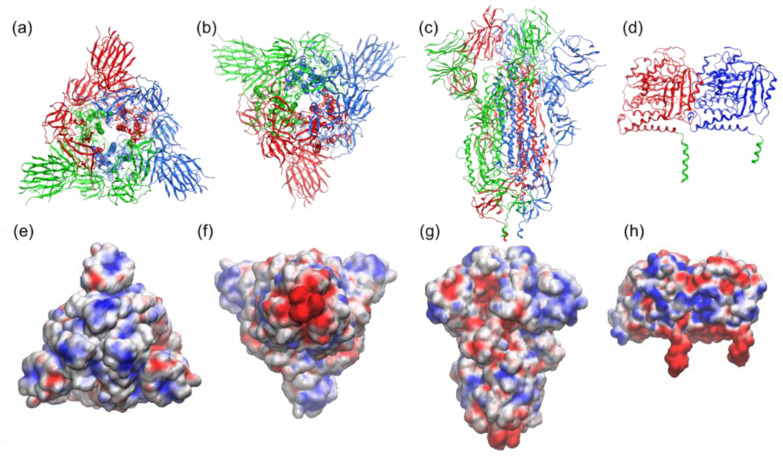
Structure and electrostatic map of the SARS-CoV-2 spike-S1 protein as viewed from (a,e) top (crown), (b,f) bottom (junction of S1 and HR2 linker; HR2 linker is not shown here), and, in (c,g), side, based on Protein Data Bank (PDB) entry 6VXX. The trimeric assembly of the spike protein (each monomer is colored in red, blue, and green) is presented as cartoon (first row) and as the electrostatic potential map (second row) highlighting a trefoil of positive charge (blue) around the central point. (d,h) Structure and electrostatic map of tubulin protein (PDB: 1jff) (α and β tubulin are in blue and red, respectively, and C-terminals are depicted in green). The VMD molecular graphics software package was used for both the execution of APBS (Adaptive Poisson–Boltzmann Solver) [35] and the visualization of the resulting electrostatic potentials. AMBER force field [36] parameters such as atomic charges and radii are assigned using PDB2PQR webserver (http://server.poissonboltzmann.org, accessed on 29 May 2021) [37].

