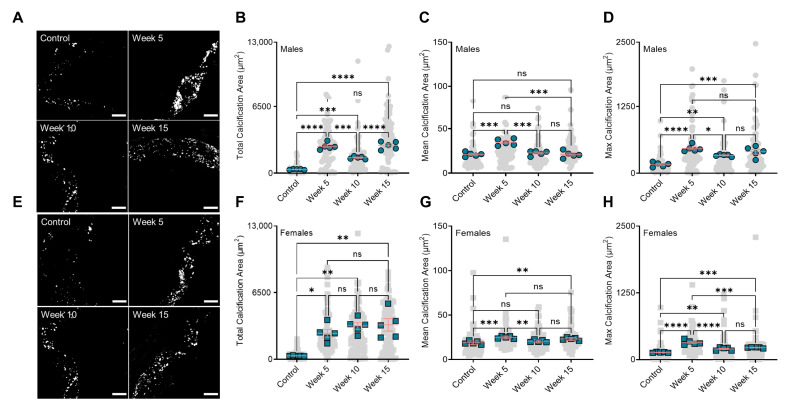
Figure 2.
BiP treatment alters the micromorphology of the minerals in the atherosclerotic plaque. (A) Visualization of the minerals in the atherosclerotic plaques of male mice (20×, scale bar 100 µm); (B) total plaque calcification in male mice; (C) mean calcification area (mean of mineral size) in male animals; (D) maximum calcification area in male mice; (E) visualization of the minerals in the atherosclerotic plaques of female mice (20×, scale bar 100 µm); (F) total plaque calcification in female mice; (G) mean calcification area (mean of mineral size) in female animals; (H) maximum calcification area in female mice. Note that gray points (● or ■) in the background represent technical replications, i.e., all calcifications measured across all mice, and green points (● or ■) represent the biological replications, i.e., the average value for each mouse. * p < 0.05, ** p ≤ 0.01, *** p ≤ 0.001, and **** p ≤ 0.0001, two-way ANOVA with Tukey’s post-hoc test. “ns” stands for not significant.

