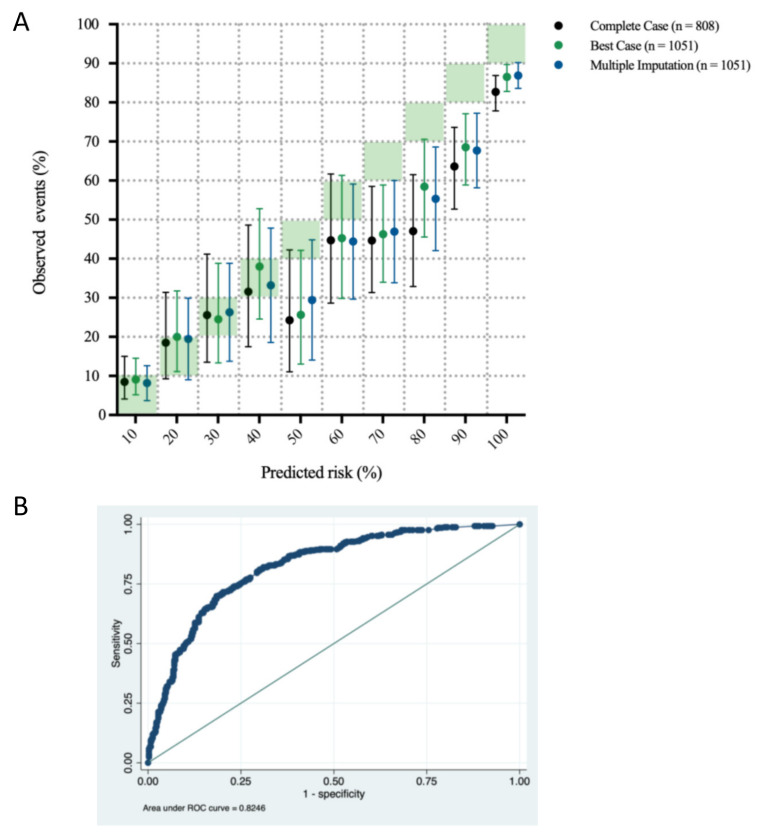
Figure 1.
(A) Observed event point estimates with 95% CIs by predicted risk deciles of poor neurologic outcomes. X-axis: Risk deciles as predicted by the PROLOGUE score; Y-axis: Observed event estimates with 95% CI (bars) for the complete case analysis (Hosmer–Lemeshow test p = 0.0024), and after best case (Hosmer–Lemeshow test p = 0.0058) and multiple data imputation (Hosmer–Lemeshow test p = 0.0122). (B) ROC curve for the PROLOGUE score applied to the complete case dataset. X-axis: 1-specificity; Y-axis: Sensitivity. Abbreviation: ROC curve, Receiver Operating Characteristic curve.

