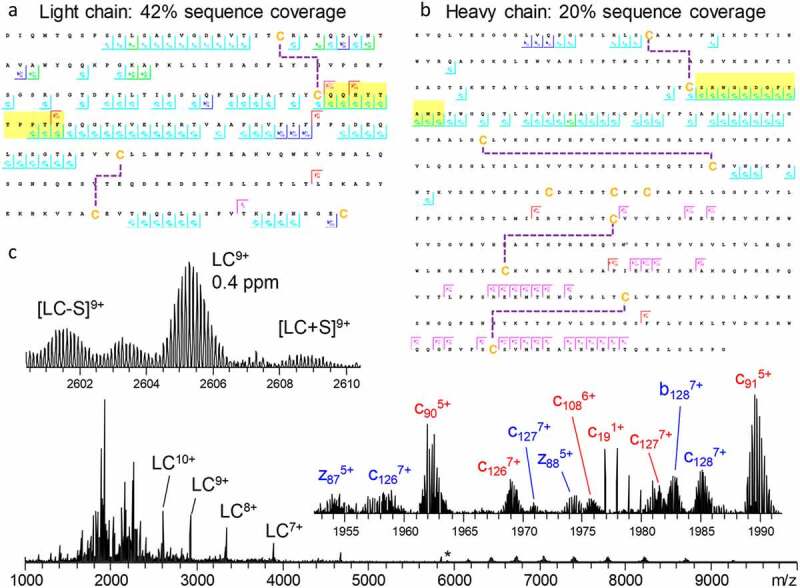
Figure 5.

Light chain (a) and glycosylated heavy chain (b) fragmentation maps illustrate sequence coverage produced by the combination of ECD and HCD on Trastuzumab. Disulfide bonds are shown by dashed lines, CDR3 regions are highlighted in yellow. The corresponding fragmentation spectrum (c) for the 25+ charge state of intact Trastuzumab with insets displaying the zoomed in region containing the 9+ charge state of the light chain and various fragment ions. Red and blue fragment ion labels correspond to the light and heavy chain, respectively. Asterisk indicates the mass-selected precursor ion. Figure adapted from Shaw et al.84
