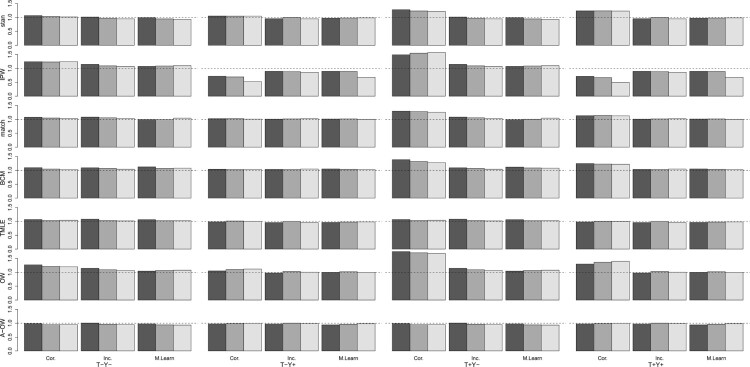
Figure 1.
Ratio of the mean estimated standard error to the standard deviation of the estimates of for the correct parametric implementation according to sample size (dark gray = 500, gray = 1000, light gray = 2000), the strength of the association between covariates and treatment (columns; weak= or strong= ) and between the covariates and outcome (weak= or strong= ), and implementation (rows; Cor = Correct parametric, Inc = Incorrect parametric, ML = machine learning).

