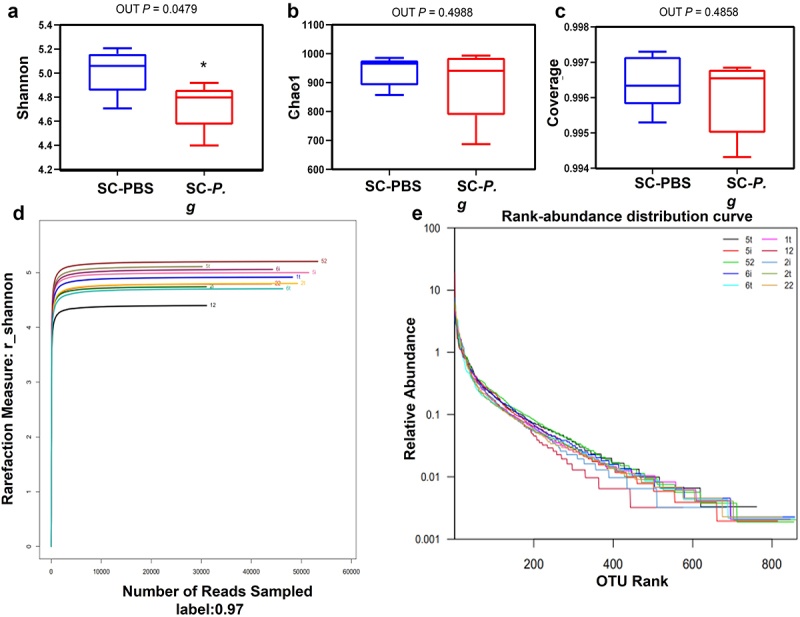
Figure 1.

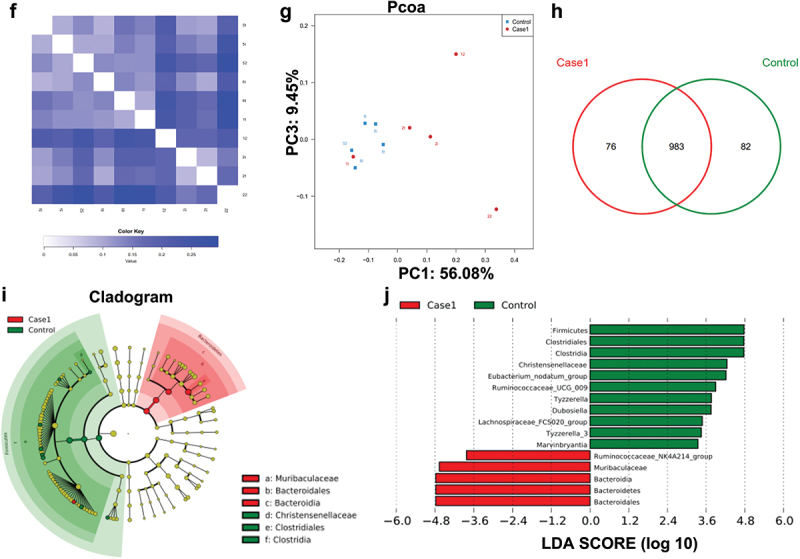
(continued).
Figure 1.

Analysis of the intestinal microbiota in the SC-PBS group and SC-P. g group. (n = 5). (A–E) Alpha diversity of the intestinal microbiota, including the diversity estimators (Shannon, Shannon-Wiener curve, and coverage) and richness estimators (Chao1 and rank-abundance distribution curve). (F, G) Beta diversity of the intestinal microbiota, including the distance heatmap and principal coordinates analysis. (H–J) Species composition and diversity, including Venn diagram of common and unique OTUs, cladogram, and linear discriminant analysis (LDA) score. * indicates a significant difference (P < 0.05). control: SC-PBS; case 1: SC-P. g. (two-tailed unpaired t-test).
