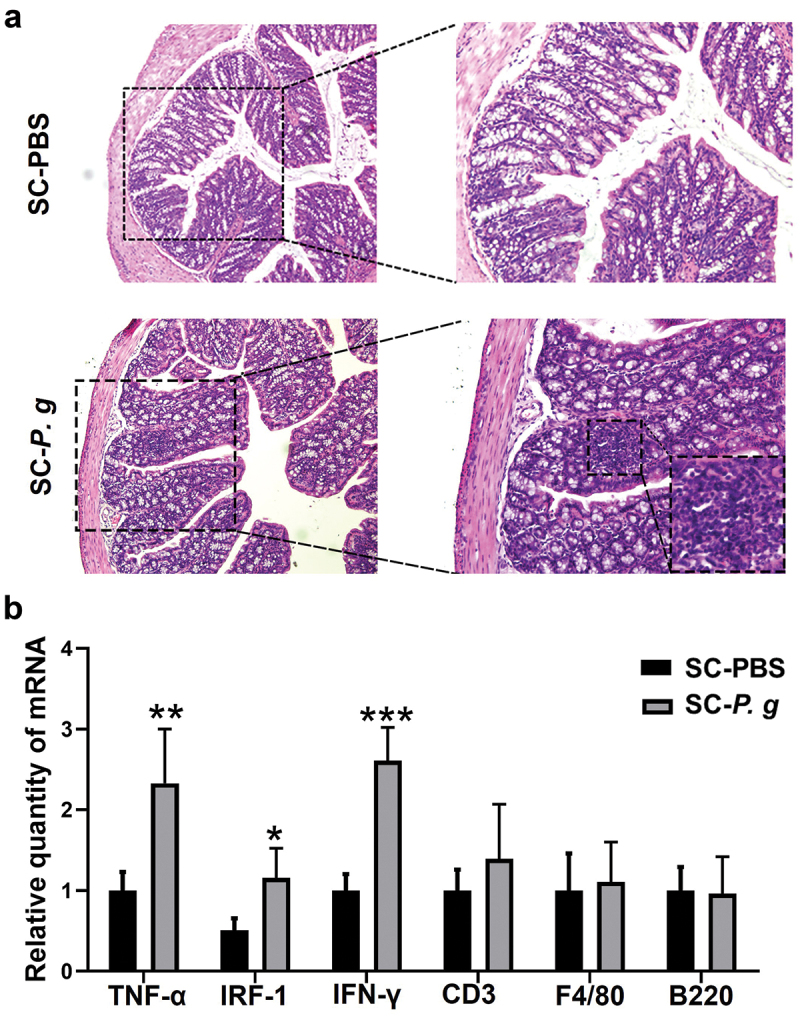
Figure 2.

Analysis of intestinal inflammation in the SC-PBS group and SC-P. g group. (n = 5). (A) Representative images of colonic tissue stained by H&E. The images were taken at the magnification of 100× and 200 × . (B) mRNA expression of inflammatory factors in the colon. *, **, and *** indicate significant differences of P < 0.05, P < 0.01, and P < 0.001 compared with the SC-PBS group, respectively. (two-tailed unpaired t-test).
