
Figure 4.
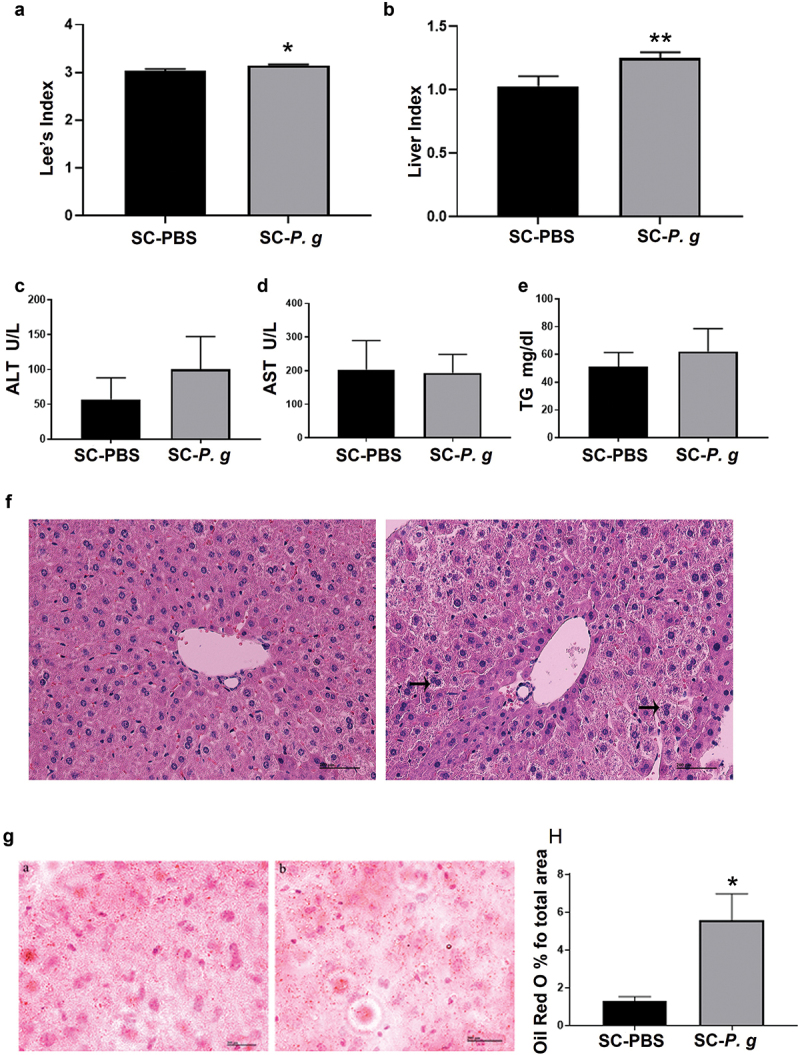
Analysis of hepatic inflammation in the SC-PBS group and SC-P. g group. (n = 5). (A, B) Lee’s index and liver index. (C-E) The levels of ALT, AST, and TG in serum. (F) Representative images of liver tissue stained by H&E. The images were taken at the magnification of 200 × (scale bar, 200 µm). Black arrows indicate ballooning degeneration. (G) Representative images of liver tissue with Oil Red O staining. The images were taken at the magnification of 200 × (scale bar, 200 µm). (H) lipid (%) were quantified by the percent of lipid area to total area and performed by ImageJ software. Statistical analyses were performed using the Mann-Whitney U test (A, E, and H) and two-tailed unpaired t-test (B, C, and D). * and ** indicate significant differences at P < 0.05 and P < a 0.01 compared with SC-PBS, respectively.