
Figure 5.
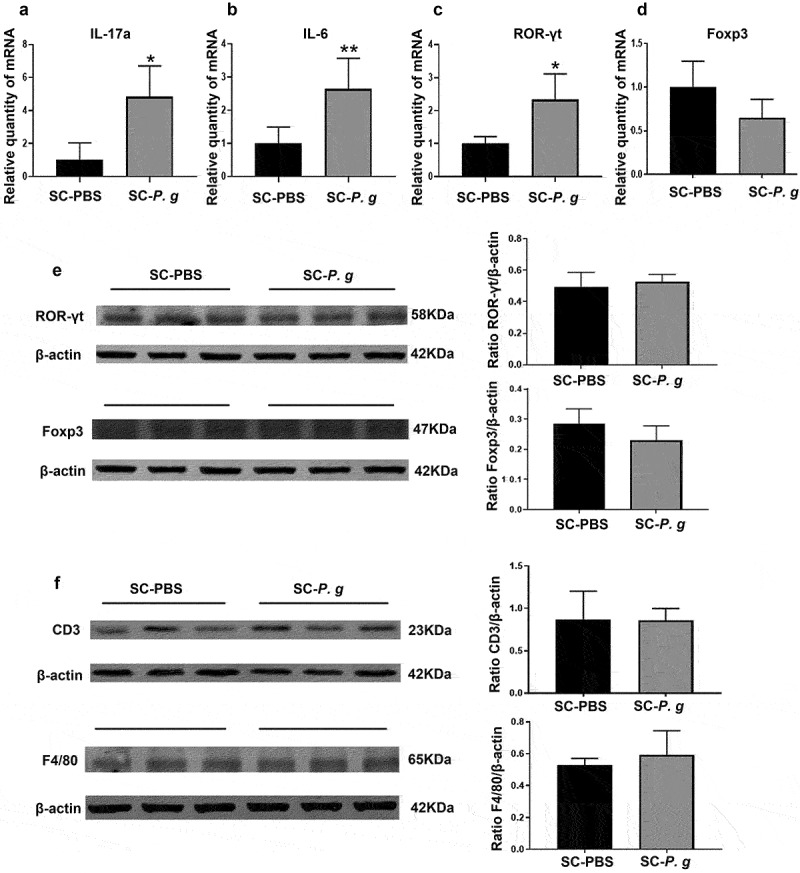
Analysis of hepatic inflammatory cell markers in the SC-PBS group and SC-P. g group. (n = 5). (A-D) mRNA expression of inflammatory markers in liver tissue in mice. (E, F) Protein levels of inflammatory cell markers in liver. Statistical analyses were performed using the Welch’s t-test (A) and unpaired t-test (B-F). * and ** indicate significant differences at P < 0.05 and P < 0.01 compared with SC-PBS, respectively.