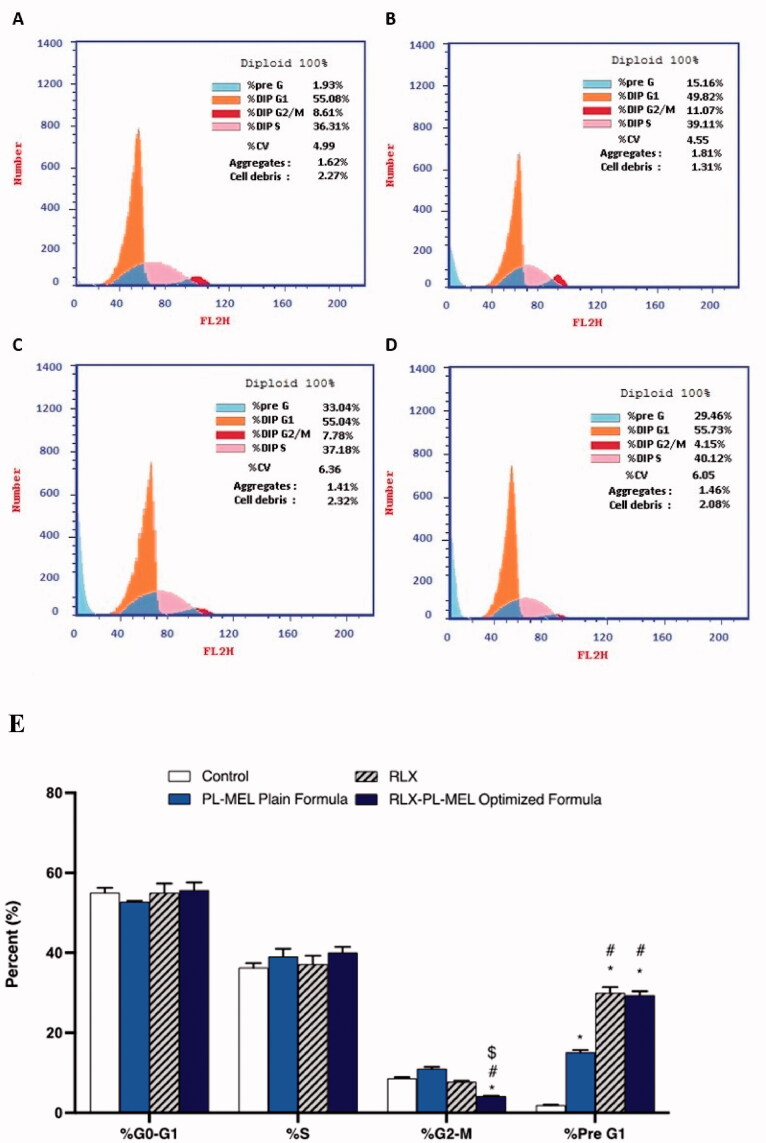
Figure 8.
Cell cycle analysis of PANC1 cells using flow cytometry assay. PANC1 cells were treated with RLX-PL-MEL or RLX for 48 h. (A) control, (B) PL-MEL plain formula, (C) RLX, and (D) RLX-PL-MEL optimized formula. (E) Graphical presentation of each phase. Data are presented as percentage of mean ± SD of three independent experiments, *,#,$p<.0001. *Significant from control, #significant from PL-MEL plain formula, and $significant from RLX treated.

