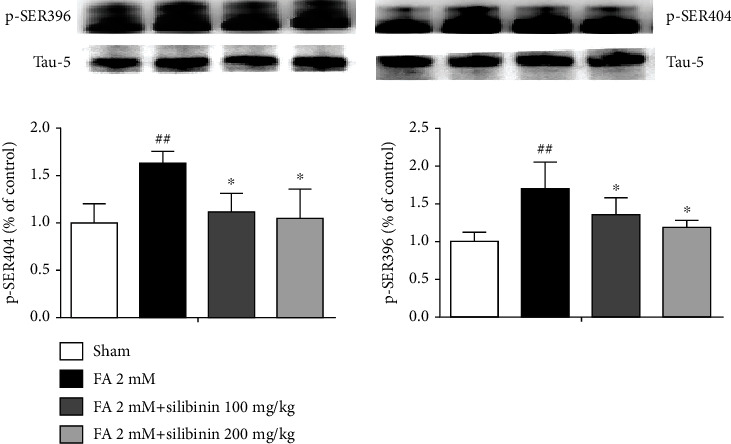
Figure 10.

Silibinin inhibition of tau protein hyperphosphorylation of p-SER-396 and p-SER-404. The data are presented as the mean ± SEM and were analyzed with one-way ANOVA, N = 4 animals per group, ##p < 0.01 compared with the sham group; ∗p < 0.05, ∗∗p < 0.01, and ∗∗∗p < 0.001 compared with the FA group.
